Loading…
Reading the draws and working out what chance predicts.
Loading…
Reading the draws and working out what chance predicts.
IE · ball game
Latest drawSaturday, 10 October 2026
Top prizeNot won — 16 draws unwonnext draw advertised at $2,200,000
SourcesOnly Primary (commercial feed) reported this draw, so there is nothing to check it against. Settled 10 Oct 2026, 21:08 UTC.
6 numbers from 1–47, plus 1 from 1–47. 1,751 draws held here since 2010-01-02 — 1,150 under the current rules.
Lotto changed its number pool then, which started a new era. Only the 1,150 draws since count towards number statistics — mixing draws from before a rule change would make any frequency meaningless.
Your numbers, read by every tool
Type the numbers you always play. Has the line ever come up? How close has Lotto come? What has each number done, what does the line look like, and has the same set turned up anywhere else in the world?
Every tool, for this game
Each one opens with Lotto already selected. The line under every title is true of this game’s rules right now — not a promise about its next draw.
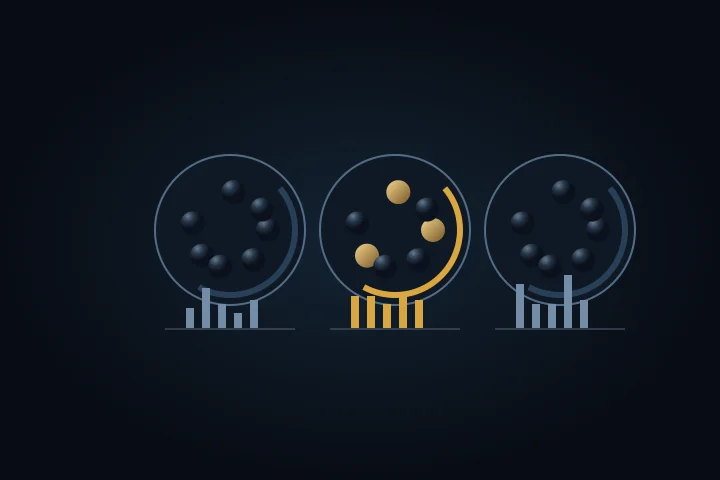
In 1,150 draws every number is expected about 147 times, and a ball favoured by more than 32% over its share would already have shown — see which ones strayed, and how far chance allows.

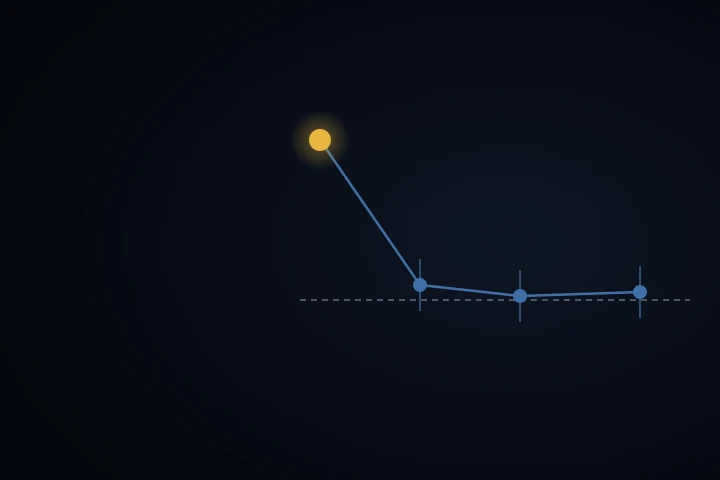
A number waits 8 draws on average; 4% of the time it waits 24 or more. It is never “due”.
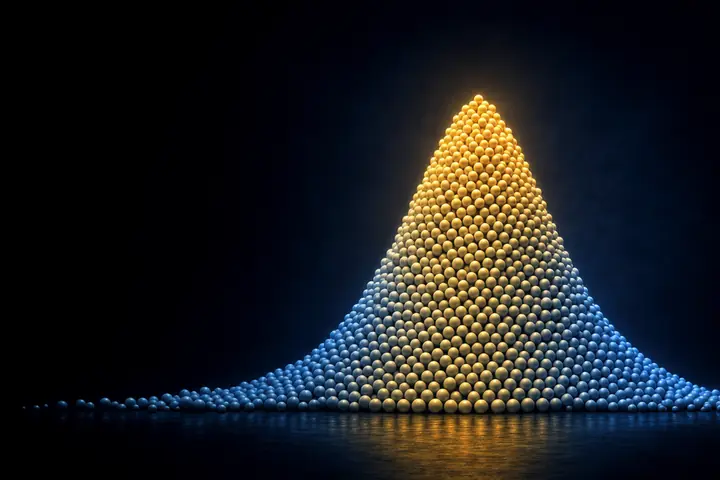
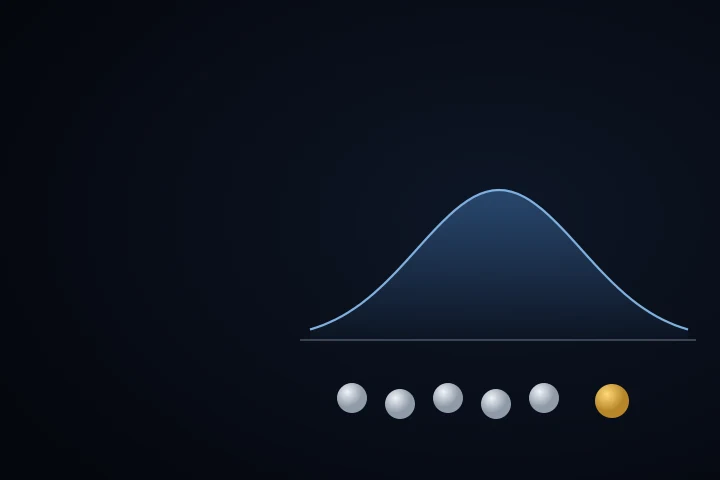
The 6 numbers add up to about 144, give or take 31. Most tickets sit in that bell — and so do most draws.
51.1% of draws contain two numbers side by side. That is the rules talking, not luck.

1,081 possible pairs, each expected together 16.0 times so far — and about 11 will look “special” by chance alone.
All 47 numbers as a constellation of who appeared with whom — indistinguishable from a shuffled sky.

58% of draws repeat a number from the draw before. A whole draw repeating: 6.0% likely by now.

Sorted, the numbers sit about 6.9 apart on average — and every “spread” you can name is exactly as likely as every other.
It takes about 33 draws for every one of the 47 numbers to appear at least once. The last few are the slow ones.
10,737,573 possible tickets. Every one has a face — and a typicality score you can look up.
Seven independent tests of randomness run live against all 1,150 draws. Any of them can fail; watch whether they do.

The lowest number lands near 7, the highest near 41. Position is a property of sorting, not of the balls.

6/47 rescaled onto the same axes as every other game here. One law, many machines.

Six documented cases of a beaten lottery. Not one involved patterns in past draws.

What the world believes about 7, 8, 13 and 17 — and what every machine says back.

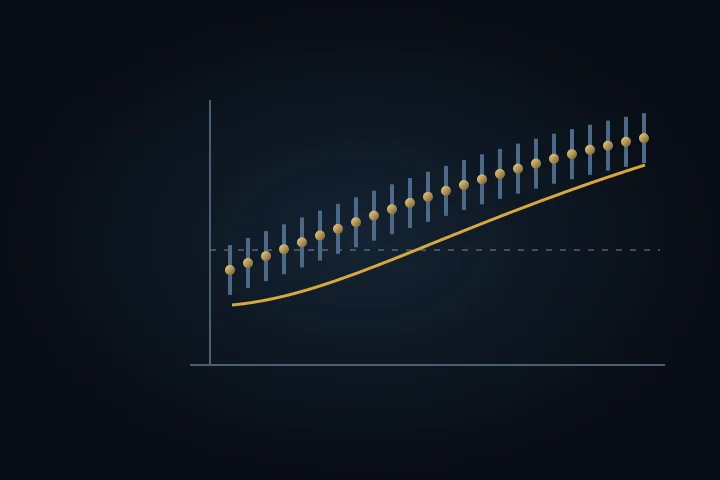
At 30 million tickets, an average line keeps about 34% of a jackpot it wins. Unpopular numbers keep more — and still lose money.
A full wheel of 10 numbers here is 210 tickets. A guarantee is real; a profit is not.

Five folk claims about 6/47 games, each answered with the closed form that kills it — never a tip for the next draw.
Take the record with youRSSJSON feedCSV, every drawDraw nights, in your calendarAPI

Lock a past-only rule, score it on later draws, and compare every hit with the exact 6-of-47 overlap law.
This is a without-replacement ball game; the Digit Laboratory is for Pick 3 and Pick 4.
Not for this game
The Chernoff Map reads the straight tier of a digit game, which counts tickets on one exact number; a ball game has no such row.
Not for this game
This game draws once a day, so it has no second draw to compare its first with.
Not for this gameThis draw, read by every tool
What the site’s explorations say about the numbers drawn on 10 October 2026 — each beside what chance predicted. None of it says anything about the next draw.
Scored 63 of 100 across six shape features — more typical than about 78% of every possible ticket.
Times drawn before — chance expected 147 of each
Every number was expected about that many times after 1,149 draws, and they scatter around it. Warm means more than expected, cool means fewer — and a cold number arriving is exactly what cold numbers do.
Frequency Explorer →Shares 4 of 6 numbers (6, 34, 38, 39) with the draw of 30 January 2019 — its closest relative in 1,149 draws. Chance gave a match this close a 74% likelihood somewhere in that history.
From the draw just before (7 October 2026): 29 carried over. Chance says 58% of draws repeat at least one number.
Carry-over / Déjà Vu →The numbers add up to 155 — the 63th percentile of all possible tickets, around a middle of 144. Side-by-side numbers: 38–39. 51% of draws have at least one such pair.
Sum Distribution →39 had not appeared for 31 draws. A number waits about 8 on average, and a wait this long was not a signal — the machine has no memory of it.
Gap & “Overdue” Tracker →A line like this is played about 0.7× as often as an average ticket — less popular than most. At 30 million tickets sold, a winner on these numbers would keep about 44% of the jackpot.
Illustrative model, calibrated to published studies — not live sales.
The Unpopular Numbers Edge →Where the money went
The rings take the ≈886k lines the counts imply and assume an evenly spread crowd. Furthest from that: Match 3 + Bonus — 1,461 winners, 13% more than the 1.3k an even spread gives. The numbers drawn were a little more popular than average — that is the crowd, not the machine.
| Match | Winners | Prize each |
|---|---|---|
| Match 6 | 0 | €2,000,000 |
| Match 5 + Bonus | 1 | €89,256 |
| Match 5 | 21 | €1,194 |
| Match 4 + Bonus | 56 | €113 |
| Match 4 | 1,024 | €38.00 |
| Match 3 + Bonus | 1,461 | €18.00 |
| Match 2 + Bonus | 12,119 | €4.00 |
| Match 3 | 16,310 | €4.00 |
What the top prize has been, draw by draw. It climbs while nobody wins and drops to the floor when somebody does — the sawtooth every rollover game draws.
The jackpot has gone 17 draws without a winner. The typical wait here is 9.8 draws.
Happenedwhat chance predicts
Completed waits between wins, against the geometric law those waits follow if every draw is an independent chance at the jackpot. The law takes its one parameter from the waits themselves, so this compares shape, not level.
Open any draw to read it by every tool — the same six readings the latest result gets above, each against what chance predicted at the time.
These waits do not fall away from zero the way the law does — they pile up in the middle. That is what happens when the chance of a win is not the same on every draw of a run: few tickets are sold when the prize is small, and so many when it is enormous that a win becomes close to certain. The wait is more predictable than a constant chance allows, and less predictable than it feels.
| Draws waited | Happened | Chance says |
|---|---|---|
| 0–1 | 14 | 18.2 |
| 2–3 | 7 | 15.0 |
| 4–5 | 17 | 12.3 |
| 6–7 | 8 | 10.2 |
| 8–9 | 13 | 8.4 |
| 10–11 | 11 | 6.9 |
| 12–13 | 7 | 5.7 |
| 14–15 | 6 | 4.7 |
| 16–17 | 4 | 3.8 |
| 18–19 | 8 | 3.2 |
| 20+ | 8 | 14.7 |
Every number was expected about that many times after 1,149 draws, and they scatter around it. Warm means more than expected, cool means fewer — and a cold number arriving is exactly what cold numbers do.
Scored 60 of 100 across six shape features — more typical than about 71% of every possible ticket.
Times drawn before — chance expected 147 of each
Every number was expected about that many times after 1,148 draws, and they scatter around it. Warm means more than expected, cool means fewer — and a cold number arriving is exactly what cold numbers do.
Frequency Explorer →Shares 4 of 6 numbers (3, 17, 29, 42) with the draw of 10 April 2019 — its closest relative in 1,148 draws. Chance gave a match this close a 74% likelihood somewhere in that history.
From the draw just before (3 October 2026): nothing carried over. Chance says 58% of draws repeat at least one number.
Carry-over / Déjà Vu →The numbers add up to 154 — the 62th percentile of all possible tickets, around a middle of 144. No two numbers side by side. 51% of draws have at least one such pair.
Sum Distribution →29 had not appeared for 18 draws. A number waits about 8 on average, and a wait this long was not a signal — the machine has no memory of it.
Gap & “Overdue” Tracker →A line like this is played about 0.9× as often as an average ticket — about as popular as most. At 30 million tickets sold, a winner on these numbers would keep about 36% of the jackpot.
Illustrative model, calibrated to published studies — not live sales.
The Unpopular Numbers Edge →Scored 52 of 100 across six shape features — more typical than about 49% of every possible ticket.
Times drawn before — chance expected 146 of each
Every number was expected about that many times after 1,147 draws, and they scatter around it. Warm means more than expected, cool means fewer — and a cold number arriving is exactly what cold numbers do.
Frequency Explorer →Shares 4 of 6 numbers (1, 7, 33, 45) with the draw of 23 February 2022 — its closest relative in 1,147 draws. Chance gave a match this close a 74% likelihood somewhere in that history.
From the draw just before (30 September 2026): nothing carried over. Chance says 58% of draws repeat at least one number.
Carry-over / Déjà Vu →The numbers add up to 151 — the 58th percentile of all possible tickets, around a middle of 144. No two numbers side by side. 51% of draws have at least one such pair.
Sum Distribution →45 had not appeared for 21 draws. A number waits about 8 on average, and a wait this long was not a signal — the machine has no memory of it.
Gap & “Overdue” Tracker →A line like this is played about 0.7× as often as an average ticket — less popular than most. At 30 million tickets sold, a winner on these numbers would keep about 42% of the jackpot.
Illustrative model, calibrated to published studies — not live sales.
The Unpopular Numbers Edge →Scored 56 of 100 across six shape features — more typical than about 60% of every possible ticket.
Times drawn before — chance expected 146 of each
Every number was expected about that many times after 1,146 draws, and they scatter around it. Warm means more than expected, cool means fewer — and a cold number arriving is exactly what cold numbers do.
Frequency Explorer →Shares 3 of 6 numbers (11, 15, 44) with the draw of 5 September 2026 — its closest relative in 1,146 draws. Chance gave a match this close a 100% likelihood somewhere in that history.
From the draw just before (26 September 2026): 36 carried over. Chance says 58% of draws repeat at least one number.
Carry-over / Déjà Vu →The numbers add up to 127 — the 29th percentile of all possible tickets, around a middle of 144. No two numbers side by side. 51% of draws have at least one such pair.
Sum Distribution →15 had not appeared for 7 draws. A number waits about 8 on average, and a wait this long was not a signal — the machine has no memory of it.
Gap & “Overdue” Tracker →A line like this is played about 1.0× as often as an average ticket — about as popular as most. At 30 million tickets sold, a winner on these numbers would keep about 33% of the jackpot.
Illustrative model, calibrated to published studies — not live sales.
The Unpopular Numbers Edge →Scored 63 of 100 across six shape features — more typical than about 77% of every possible ticket.
Times drawn before — chance expected 146 of each
Every number was expected about that many times after 1,145 draws, and they scatter around it. Warm means more than expected, cool means fewer — and a cold number arriving is exactly what cold numbers do.
Frequency Explorer →Shares 4 of 6 numbers (6, 13, 14, 42) with the draw of 4 February 2023 — its closest relative in 1,145 draws. Chance gave a match this close a 74% likelihood somewhere in that history.
From the draw just before (23 September 2026): nothing carried over. Chance says 58% of draws repeat at least one number.
Carry-over / Déjà Vu →The numbers add up to 133 — the 36th percentile of all possible tickets, around a middle of 144. Side-by-side numbers: 13–14. 51% of draws have at least one such pair.
Sum Distribution →22 had not appeared for 14 draws. A number waits about 8 on average, and a wait this long was not a signal — the machine has no memory of it.
Gap & “Overdue” Tracker →A line like this is played about 0.6× as often as an average ticket — less popular than most. At 30 million tickets sold, a winner on these numbers would keep about 47% of the jackpot.
Illustrative model, calibrated to published studies — not live sales.
The Unpopular Numbers Edge →Scored 61 of 100 across six shape features — more typical than about 72% of every possible ticket.
Times drawn before — chance expected 146 of each
Every number was expected about that many times after 1,144 draws, and they scatter around it. Warm means more than expected, cool means fewer — and a cold number arriving is exactly what cold numbers do.
Frequency Explorer →Shares 4 of 6 numbers (2, 12, 30, 37) with the draw of 13 February 2016 — its closest relative in 1,144 draws. Chance gave a match this close a 74% likelihood somewhere in that history.
From the draw just before (19 September 2026): nothing carried over. Chance says 58% of draws repeat at least one number.
Carry-over / Déjà Vu →The numbers add up to 124 — the 26th percentile of all possible tickets, around a middle of 144. No two numbers side by side. 51% of draws have at least one such pair.
Sum Distribution →12 had not appeared for 22 draws. A number waits about 8 on average, and a wait this long was not a signal — the machine has no memory of it.
Gap & “Overdue” Tracker →A line like this is played about 1.4× as often as an average ticket — more popular than most. At 30 million tickets sold, a winner on these numbers would keep about 26% of the jackpot.
Illustrative model, calibrated to published studies — not live sales.
The Unpopular Numbers Edge →Scored 73 of 100 across six shape features — more typical than about 94% of every possible ticket.
Times drawn before — chance expected 146 of each
Every number was expected about that many times after 1,143 draws, and they scatter around it. Warm means more than expected, cool means fewer — and a cold number arriving is exactly what cold numbers do.
Frequency Explorer →Shares 4 of 6 numbers (10, 20, 28, 44) with the draw of 30 July 2016 — its closest relative in 1,143 draws. Chance gave a match this close a 74% likelihood somewhere in that history.
From the draw just before (16 September 2026): 20 carried over. Chance says 58% of draws repeat at least one number.
Carry-over / Déjà Vu →The numbers add up to 154 — the 62th percentile of all possible tickets, around a middle of 144. Side-by-side numbers: 10–11. 51% of draws have at least one such pair.
Sum Distribution →28 had not appeared for 9 draws. A number waits about 8 on average, and a wait this long was not a signal — the machine has no memory of it.
Gap & “Overdue” Tracker →A line like this is played about 1.0× as often as an average ticket — about as popular as most. At 30 million tickets sold, a winner on these numbers would keep about 33% of the jackpot.
Illustrative model, calibrated to published studies — not live sales.
The Unpopular Numbers Edge →Scored 71 of 100 across six shape features — more typical than about 91% of every possible ticket.
Times drawn before — chance expected 146 of each
Every number was expected about that many times after 1,142 draws, and they scatter around it. Warm means more than expected, cool means fewer — and a cold number arriving is exactly what cold numbers do.
Frequency Explorer →Shares 4 of 6 numbers (4, 20, 35, 42) with the draw of 14 January 2023 — its closest relative in 1,142 draws. Chance gave a match this close a 74% likelihood somewhere in that history.
From the draw just before (12 September 2026): 19 carried over. Chance says 58% of draws repeat at least one number.
Carry-over / Déjà Vu →The numbers add up to 127 — the 29th percentile of all possible tickets, around a middle of 144. Side-by-side numbers: 19–20. 51% of draws have at least one such pair.
Sum Distribution →4 had not appeared for 50 draws. A number waits about 8 on average, and a wait this long was not a signal — the machine has no memory of it.
Gap & “Overdue” Tracker →A line like this is played about 1.1× as often as an average ticket — about as popular as most. At 30 million tickets sold, a winner on these numbers would keep about 31% of the jackpot.
Illustrative model, calibrated to published studies — not live sales.
The Unpopular Numbers Edge →Scored 17 of 100 across six shape features — more typical than about 1% of every possible ticket.
Times drawn before — chance expected 146 of each
Every number was expected about that many times after 1,141 draws, and they scatter around it. Warm means more than expected, cool means fewer — and a cold number arriving is exactly what cold numbers do.
Frequency Explorer →Shares 4 of 6 numbers (3, 9, 16, 19) with the draw of 23 March 2022 — its closest relative in 1,141 draws. Chance gave a match this close a 74% likelihood somewhere in that history.
From the draw just before (9 September 2026): 16 carried over. Chance says 58% of draws repeat at least one number.
Carry-over / Déjà Vu →The numbers add up to 62 — the 0th percentile of all possible tickets, around a middle of 144. No two numbers side by side. 51% of draws have at least one such pair.
Sum Distribution →19 had not appeared for 23 draws. A number waits about 8 on average, and a wait this long was not a signal — the machine has no memory of it.
Gap & “Overdue” Tracker →A line like this is played about 3.4× as often as an average ticket — more popular than most. At 30 million tickets sold, a winner on these numbers would keep about 10% of the jackpot.
Illustrative model, calibrated to published studies — not live sales.
The Unpopular Numbers Edge →Scored 61 of 100 across six shape features — more typical than about 74% of every possible ticket.
Times drawn before — chance expected 146 of each
Every number was expected about that many times after 1,140 draws, and they scatter around it. Warm means more than expected, cool means fewer — and a cold number arriving is exactly what cold numbers do.
Frequency Explorer →Shares 4 of 6 numbers (13, 18, 34, 38) with the draw of 9 October 2021 — its closest relative in 1,140 draws. Chance gave a match this close a 74% likelihood somewhere in that history.
From the draw just before (5 September 2026): nothing carried over. Chance says 58% of draws repeat at least one number.
Carry-over / Déjà Vu →The numbers add up to 150 — the 57th percentile of all possible tickets, around a middle of 144. No two numbers side by side. 51% of draws have at least one such pair.
Sum Distribution →34 had not appeared for 37 draws. A number waits about 8 on average, and a wait this long was not a signal — the machine has no memory of it.
Gap & “Overdue” Tracker →A line like this is played about 0.6× as often as an average ticket — less popular than most. At 30 million tickets sold, a winner on these numbers would keep about 50% of the jackpot.
Illustrative model, calibrated to published studies — not live sales.
The Unpopular Numbers Edge →Scored 60 of 100 across six shape features — more typical than about 71% of every possible ticket.
Times drawn before — chance expected 145 of each
Every number was expected about that many times after 1,139 draws, and they scatter around it. Warm means more than expected, cool means fewer — and a cold number arriving is exactly what cold numbers do.
Frequency Explorer →Shares 3 of 6 numbers (11, 21, 33) with the draw of 6 August 2025 — its closest relative in 1,139 draws. Chance gave a match this close a 100% likelihood somewhere in that history.
From the draw just before (2 September 2026): nothing carried over. Chance says 58% of draws repeat at least one number.
Carry-over / Déjà Vu →The numbers add up to 132 — the 35th percentile of all possible tickets, around a middle of 144. No two numbers side by side. 51% of draws have at least one such pair.
Sum Distribution →44 had not appeared for 6 draws. A number waits about 8 on average, and a wait this long was not a signal — the machine has no memory of it.
Gap & “Overdue” Tracker →A line like this is played about 1.0× as often as an average ticket — about as popular as most. At 30 million tickets sold, a winner on these numbers would keep about 33% of the jackpot.
Illustrative model, calibrated to published studies — not live sales.
The Unpopular Numbers Edge →Scored 42 of 100 across six shape features — more typical than about 25% of every possible ticket.
Times drawn before — chance expected 145 of each
Every number was expected about that many times after 1,138 draws, and they scatter around it. Warm means more than expected, cool means fewer — and a cold number arriving is exactly what cold numbers do.
Frequency Explorer →Shares 4 of 6 numbers (2, 13, 41, 46) with the draw of 6 March 2019 — its closest relative in 1,138 draws. Chance gave a match this close a 74% likelihood somewhere in that history.
From the draw just before (29 August 2026): 38 carried over. Chance says 58% of draws repeat at least one number.
Carry-over / Déjà Vu →The numbers add up to 177 — the 85th percentile of all possible tickets, around a middle of 144. Side-by-side numbers: 37–38. 51% of draws have at least one such pair.
Sum Distribution →37 had not appeared for 10 draws. A number waits about 8 on average, and a wait this long was not a signal — the machine has no memory of it.
Gap & “Overdue” Tracker →A line like this is played about 0.3× as often as an average ticket — less popular than most. At 30 million tickets sold, a winner on these numbers would keep about 67% of the jackpot.
Illustrative model, calibrated to published studies — not live sales.
The Unpopular Numbers Edge →