Loading…
Reading the draws and working out what chance predicts.
Loading…
Reading the draws and working out what chance predicts.
The playground
54 explorations of 163 lotteries and 1,058,180 draws. Every one shows what chance predicts beside what actually happened — because raw counts always look patterned, and the real mathematics is stranger than the myths.
Start with a question
Patterns, formulas and history
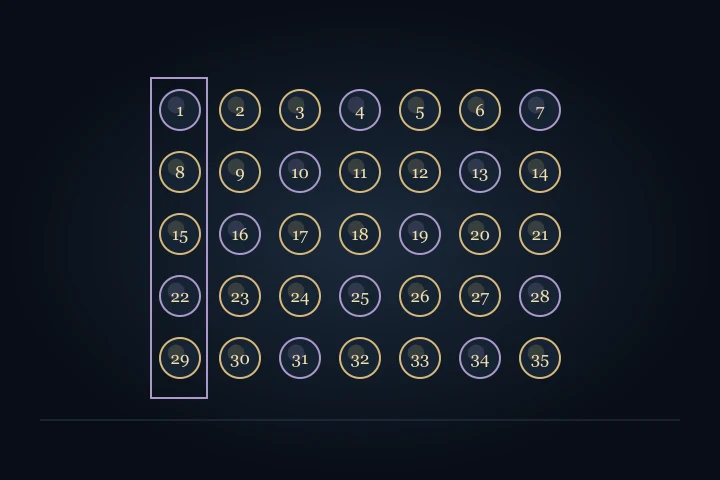
Combine primes, squares, Fibonacci numbers and sums. Count how much of chance your recipe describes.
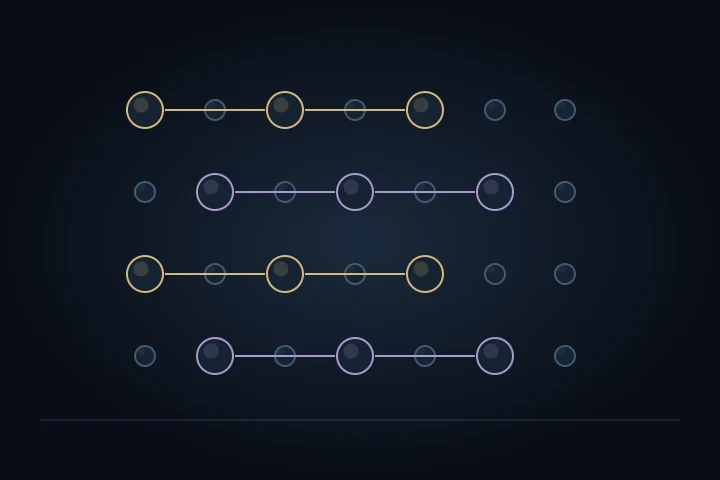
Find equal steps and mirror pairs in history, then grow a fair comparison.
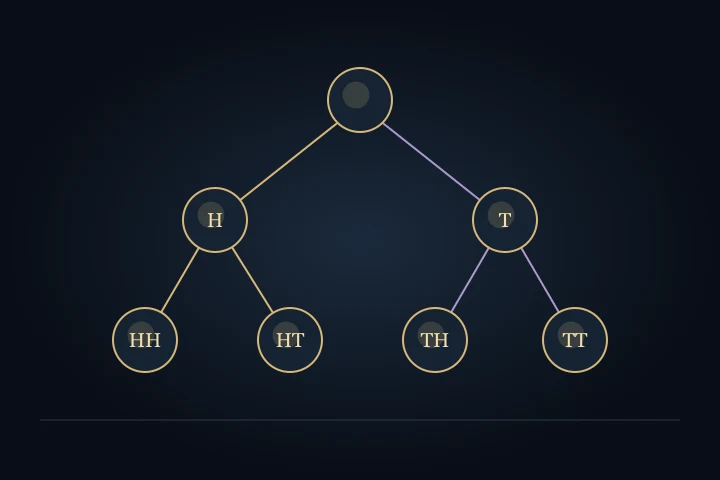
HH and HT each have a one-in-four chance in two flips. Why does one take longer to arrive?
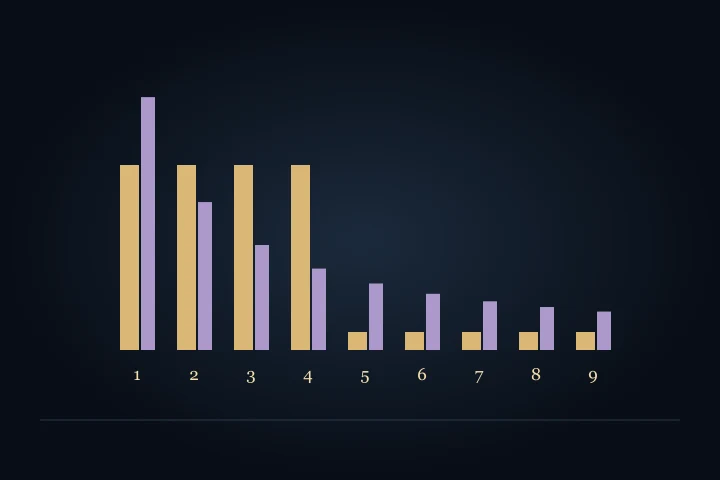
Give fair numbers the wrong baseline and watch an innocent pattern appear.
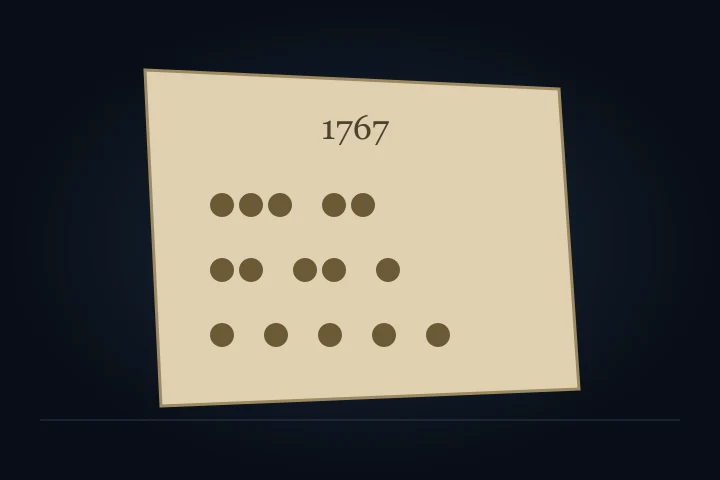
From a 1767 paper to every possible arrangement of consecutive runs.
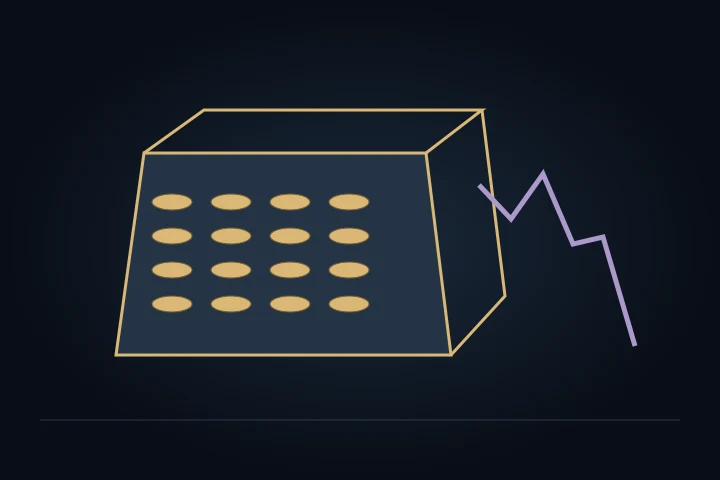
A profitable lottery can still run out of money. Explore a fictional treasury inspired by history.
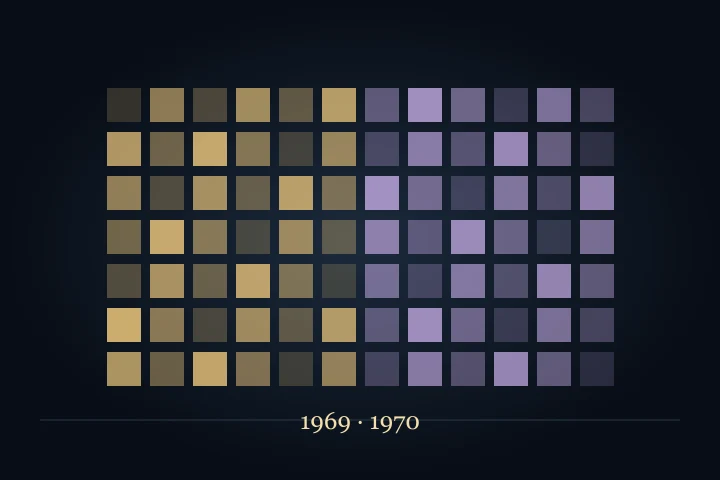
Read the 1969 and 1970 US draft drawings through their actual calendar ranks.
A royal proposal, an annuity ticket and a national collection: three objects from lottery history.
Investigate, play, understand
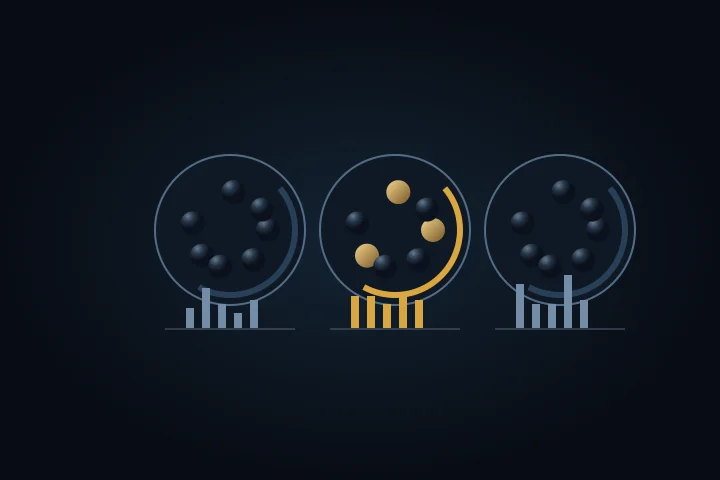
Three simulated machines. Which would you investigate?

Find a miracle in a fair archive, then count the searches that found it.
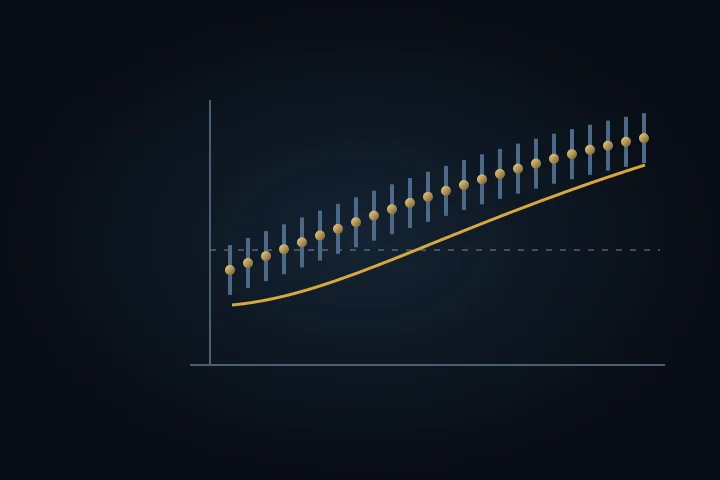
Does the estimated preference for birthday numbers change over time or with jackpots?
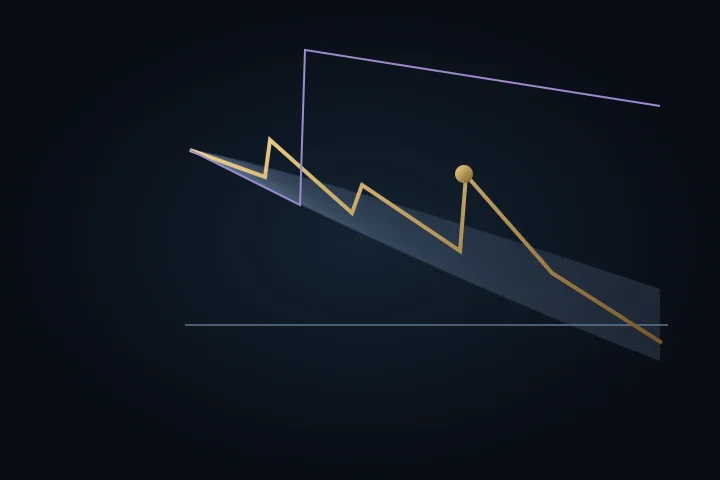
One hypothetical routine, thousands of lives, and the full spread of outcomes.
Start here — one number at a time
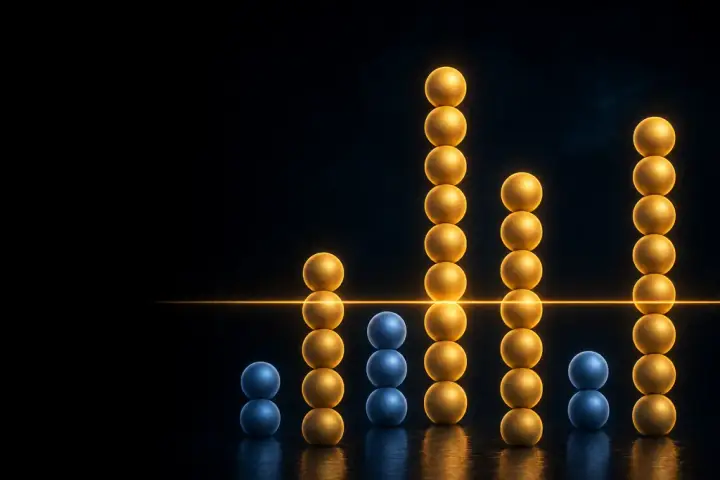
Hot and cold numbers, shown against what chance actually predicts.

How long since each number appeared — and why “due” is a fiction.
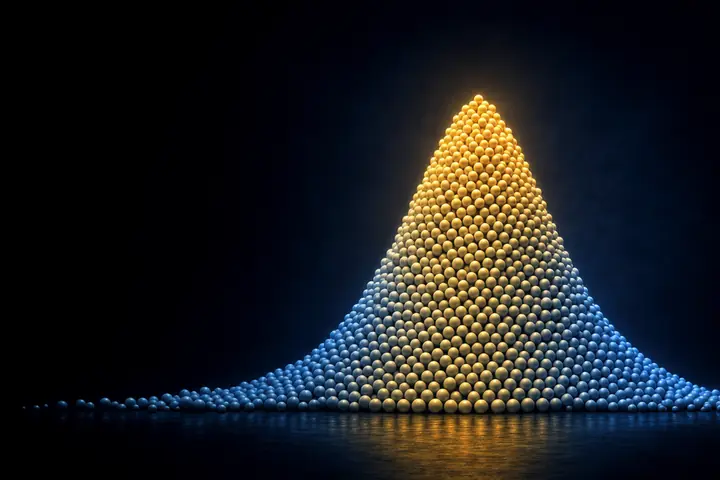
The bell curve of luck: why draw totals cluster in the middle.

Roughly half of all draws contain two numbers in a row. Really.
How numbers relate to each other
Every pair of numbers, and how often they have come up together.

The draw history as a network of glowing, connected numbers.

Numbers repeating from the previous draw, and the Bulgaria 2009 case.

The gaps between the numbers within a draw, and their real shape.
Going deeper
How long until every single number has appeared at least once.

Every draw as a point in feature space — explore the whole history.
Chi-squared, runs, entropy and autocorrelation, tracked over time.

Where the smallest, second-smallest and largest numbers tend to fall.

Different games, normalised onto one scale, behaving identically.
Culture, true stories, and the one real edge

Mandel, Tipton, the Triple Six Fix — when the lottery really was beaten.

Lucky 7, unlucky 4, the Smorfia — what the world believes about numbers.

The one real edge: not winning more often, but sharing less.
Covering designs — guaranteeing a small win, at a price.

“Due”, “hot”, “cold” — pick a folk claim and see the math that kills it.
Test the pattern — sequence laboratories

Lock hot, cold or overdue rules, then judge them only on future draws.

Give every complete combination one rank and inspect the resulting river.
Evidence that stays valid even when the monitor is checked after every draw.

Compare two regimes as complete draw-sets, without cherry-picking a feature.

Hold every ball frequency fixed and see which pair patterns remain.

Turn odd/even into modulo 2–10, with the exact finite-pool baseline.
Pick 3 and Pick 4 analysed as positional digits drawn with replacement.
Use prize-table winners to test and calibrate the crowd-popularity model.

Measure each detector’s false alarms and power on independent synthetic histories.

Separate single-ball, pair-after-single, and whole-draw structure on the subset slice.
Ask whether ranks, overlaps, or spacings are suspiciously easy to describe.
Choose a pattern model on discovery data, then make it predict untouched later draws.

An anytime-valid whole-draw alarm that does not need to name the fault in advance.

Translate every completed wait onto one uniform ruler and test what remains.

Which numbers the crowd already holds, measured from prize tables rather than assumed.
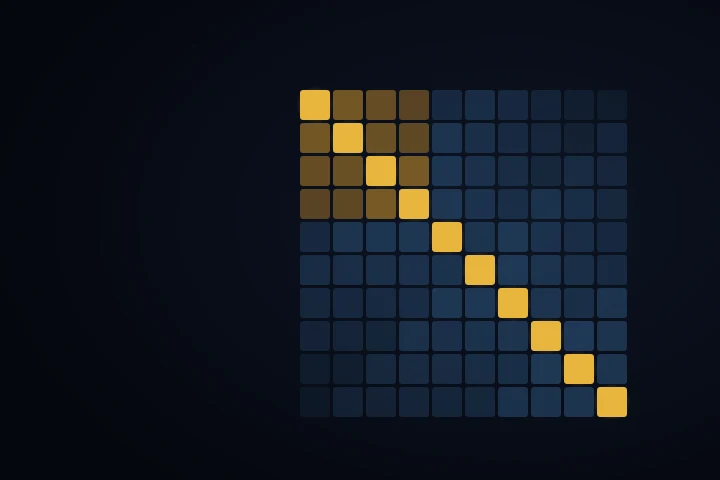
Every Pick 3 and Pick 4 number, shaded by how many people are holding it.
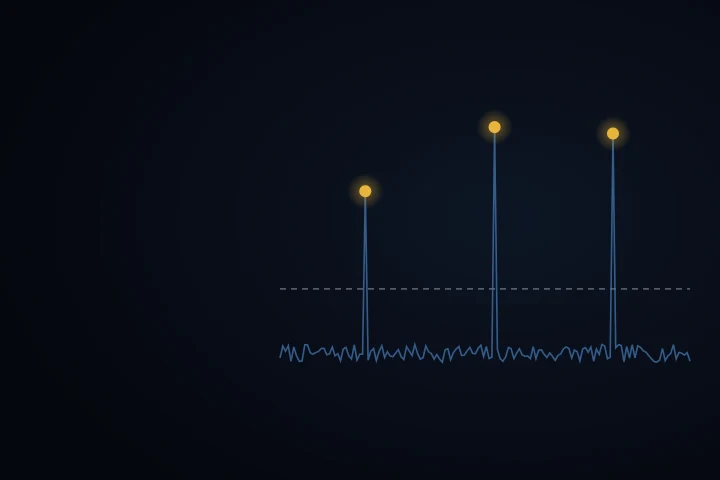
What a game actually paid back, draw by draw, and every night it paid out more than it took.
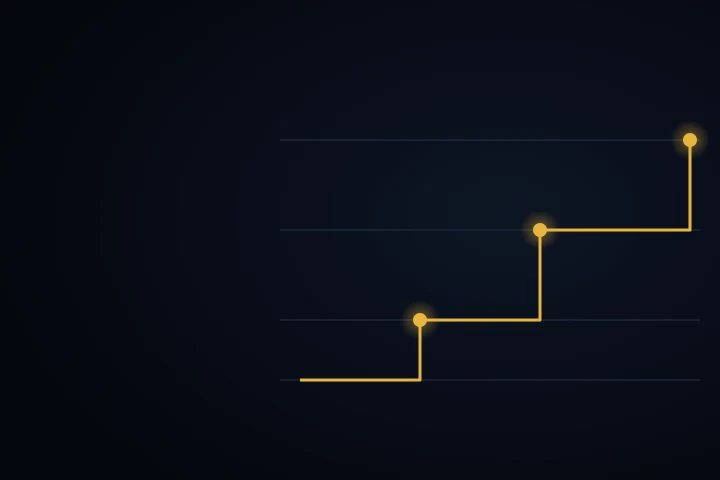
Every rule era a game has had, and by how much each redesign lengthened the odds.

Every drum and every set of balls tested on its own, where a physical fault could hide.
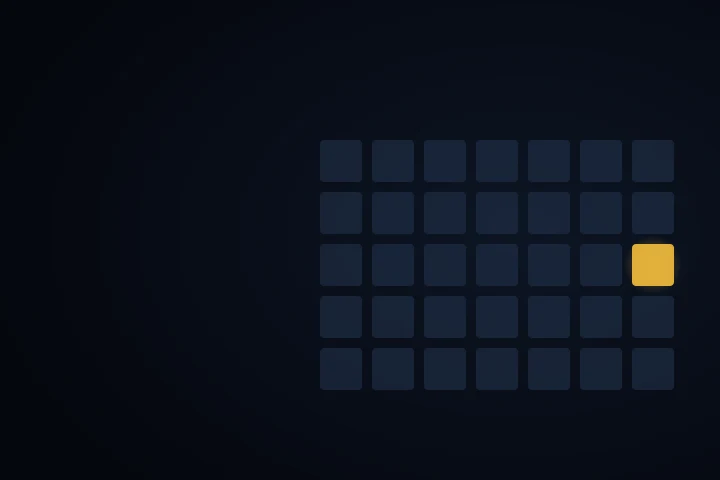
Six ways of splitting the calendar, asking whether the machine is fair on every day of the year.

Whether a day’s two draws know about each other, and how the two ways of drawing compare.

Every game tested the same way, and one distribution that answers the question people arrive with.
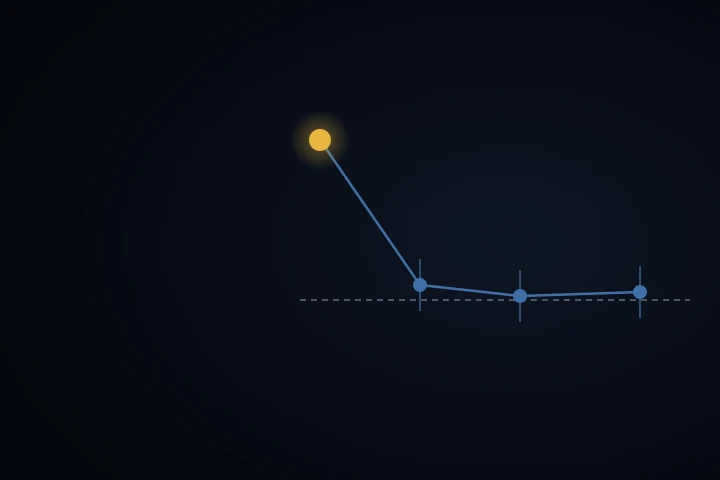
Every anomaly this site would have called remarkable, and what fresh draws said about it afterwards.
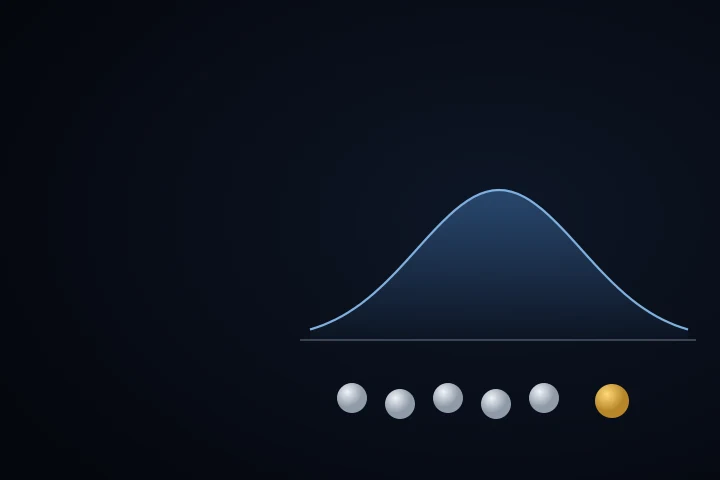
Build the game yourself — k, N, a bonus drum, a price and a prize ladder — and read what you built.