LotteryOracle
GamesForecastPlaygroundCase filesMy numbers

Loading…

Reading the draws and working out what chance predicts.

LotteryOracle

LotteryOracle reports what happened; it does not predict what is next. Every draw is independent — no number is ever "due".

GamesPlaygroundCase filesThe weekDataAboutMethodologyPrivacy
Built byejoyful

Responsible play.A lottery costs more than it pays back; if it stops being fun, help is free and confidential:🇨🇦 1-866-531-2600all helplines →

CA · ball game

Canada Lotto 6/49

The operator’s own page

On this page
  • Latest draw
  • Next draw
  • This draw, read by every tool
  • Your numbers
  • Tools
  • Prize ladder
  • Jackpot
  • Recent draws

Latest drawSaturday, 10 October 2026

Single source
  1. 12
  2. 18
  3. 23
  4. 27
  5. 28
  6. 45
  7. 32

JackpotCA$5,000,000

Top prizeWon by one ticketnext draw advertised at CA$22,000,000

SourcesOnly Primary (commercial feed) reported this draw, so there is nothing to check it against. Settled 11 Oct 2026, 12:23 UTC.

  • Primarycommercial feed11 Oct 2026, 12:23 UTC

Next drawWednesday, 14 October 202623:30 Halifax time · schedule not confirmed

–days–hrs–min–sec


What it will look like — before a single ball moves

Every number12% chance each

All 49 numbers have the same chance of coming out — including the ones that have waited longest:

40352923152122204420

Draws since each last appeared. A wait is not a debt: the machine keeps no ledger.

The total117–183

The main numbers will add up to somewhere in this band in about 68% of draws, around a middle of 150. Most tickets sit there too, so it is no edge.

Shape3 odd + 3 even

The likeliest split, at 33%. And a 50% chance that two numbers come out side by side — the rules talking, not luck.

Déjà vu56% chance of a repeat

That at least one of the latest draw’s numbers (12, 18, 23, 27, 28, 45) comes straight back. Repeats are ordinary; a whole draw repeating is not.

The jackpot29% chance it goes

If about 4.7M lines are played again, as the last prize table implied, expect 0.34 jackpot winners — so a rollover is the likelier outcome. Around 712k lines will win something (1 in 7).

If you playLeast played: 32–39, 41–49

No number wins more often. A line of numbers the crowd avoids — above 31, not round, not lucky — wins exactly as often and shares less when it does. That is the only edge there is, and it still loses money.

Everything above is a property of the rules and the odds, not a tip about the numbers. The machine has no memory; nothing is ever due.

6 numbers from 1–49, plus 1 from 1–49. 1,751 draws held here since 2010-01-02.

No independent confirmationpool inferredEvery number →My numbers →
13,983,816possible tickets
214times each number is expected so far
56%of draws repeat a number from the last one

Your numbers, read by every tool

Type the numbers you always play. Has the line ever come up? How close has Canada Lotto 6/49 come? What has each number done, what does the line look like, and has the same set turned up anywhere else in the world?

0 of 6 picked · order does not matter

Every tool, for this game

Each one opens with Canada Lotto 6/49 already selected. The line under every title is true of this game’s rules right now — not a promise about its next draw.
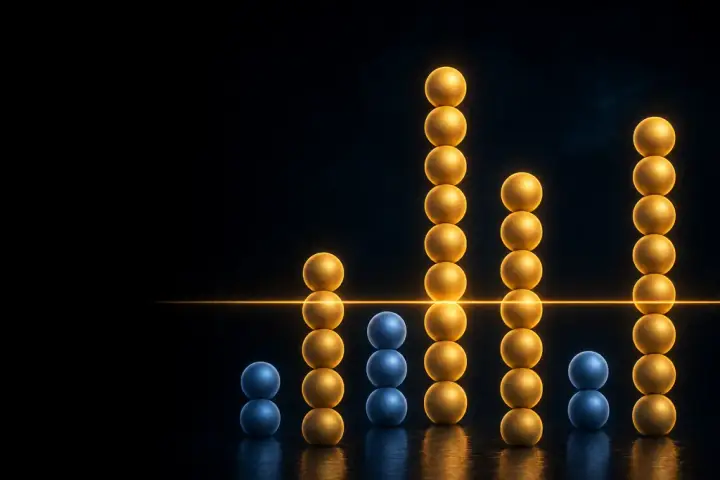
Frequency Explorer

In 1,751 draws every number is expected about 214 times, and a ball favoured by more than 26% over its share would already have shown — see which ones strayed, and how far chance allows.

Gap & “Overdue” Tracker

A number waits 8 draws on average; 4% of the time it waits 25 or more. It is never “due”.
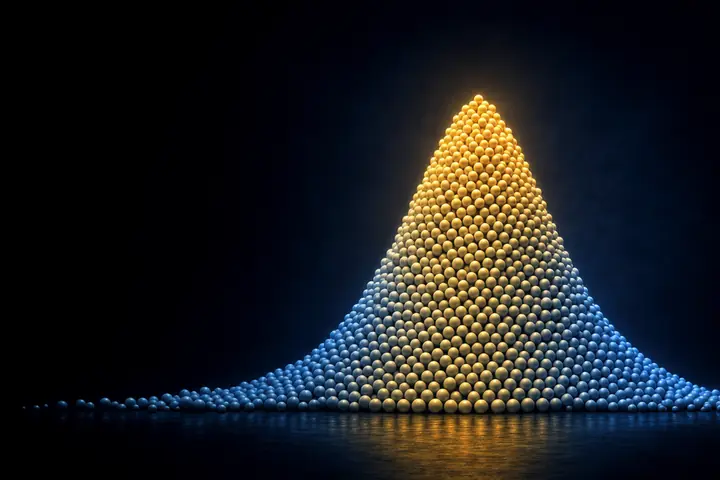
Sum Distribution

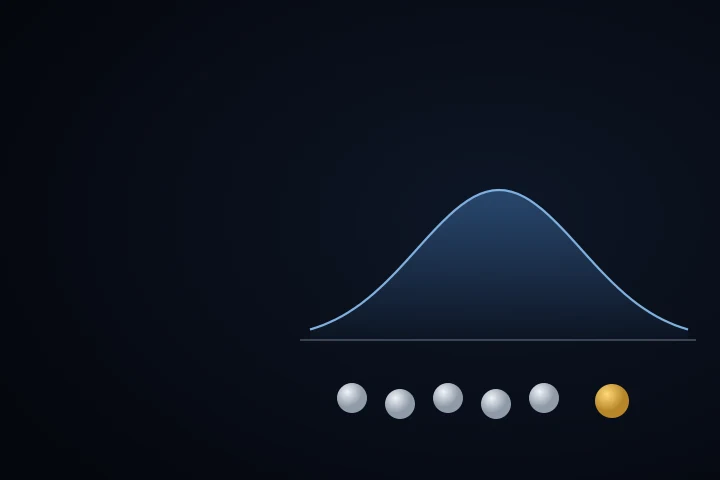
The 6 numbers add up to about 150, give or take 33. Most tickets sit in that bell — and so do most draws.
Consecutive Numbers Surprise

49.5% of draws contain two numbers side by side. That is the rules talking, not luck.
Harmony Matrix

1,176 possible pairs, each expected together 22.3 times so far — and about 12 will look “special” by chance alone.
Number Constellation

All 49 numbers as a constellation of who appeared with whom — indistinguishable from a shuffled sky.

Carry-over / Déjà Vu

56% of draws repeat a number from the draw before. A whole draw repeating: 10.4% likely by now.

Delta Space

Sorted, the numbers sit about 7.1 apart on average — and every “spread” you can name is exactly as likely as every other.
The other 43 tools for Canada Lotto 6/49

Coverage Race

It takes about 35 draws for every one of the 49 numbers to appear at least once. The last few are the slow ones.

Draw Fingerprints

13,983,816 possible tickets. Every one has a face — and a typicality score you can look up.
Randomness Observatory

Seven independent tests of randomness run live against all 1,751 draws. Any of them can fail; watch whether they do.

Positional Ribbons

The lowest number lands near 7, the highest near 43. Position is a property of sorting, not of the balls.

Cross-Lottery Mirror

6/49 rescaled onto the same axes as every other game here. One law, many machines.

Six true stories

Six documented cases of a beaten lottery. Not one involved patterns in past draws.

Cultural Numbers Atlas

What the world believes about 7, 8, 13 and 17 — and what every machine says back.

The Unpopular Numbers Edge

At 30 million tickets, an average line keeps about 41% of a jackpot it wins. Unpopular numbers keep more — and still lose money.
Wheel Workshop

A full wheel of 10 numbers here is 210 tickets. A guarantee is real; a profit is not.

Myth Rebuttal

Five folk claims about 6/49 games, each answered with the closed form that kills it — never a tip for the next draw.

Take the record with youRSSJSON feedCSV, every drawDraw nights, in your calendarAPI
Pattern Court

Lock a past-only rule, score it on later draws, and compare every hit with the exact 6-of-49 overlap law.

Draw Rank Stream

Every one of 13,983,816 possible draws receives a unique rank; a fair stream fills that line uniformly.

Anytime Bias Watch

Monitor all 49 balls after every draw without optional-stopping tricks; evidence 20× is the predeclared 5% alarm line.

Whole-Draw Drift

Compare adjacent eras as complete 6-ball sets, so no “interesting” number or summary is chosen after looking.

Conditional Harmony

Shuffle while preserving all 49 ball totals and every draw size; only pair structure beyond solo frequency remains.

Residue Kaleidoscope

Odd/even is modulo 2. Turn the dial through 10 and compare each colour recipe with its exact finite-pool law.

Crowd Calibration Lab

Prize-table winner counts can infer ticket exposure and test whether this game follows the literature-based crowd model.

Calibration Forge

Benchmark six detectors at 100 and 400 synthetic 6-of-49 draws: false alarms beside power, before interpreting history.

Johnson Spectrum

Resolve this 6-of-49 history into single-ball, pair-after-single, and all-degree structural bands.

Compression Lab

Test whether whole-draw ranks, successive overlaps, or spacings compress more than shuffled chronology.

Forecast Arena

Let hot, cold, overdue, and repeat models learn on discovery draws, then score one locked challenger on untouched 6-of-49 outcomes.

Exchangeability Watch

Monitor complete 6-ball draws with conformal evidence that remains valid whenever the watch is inspected.

Gap Uniformizer

Map every completed wait through its geometric 6/49 law, then test the common 0–1 residual ruler.

Sharing Map

A number a date could have produced is held 28% more often here than an average one, so the same win is split more ways.

Return Ledger

Read what this game paid back across 1,751 draws, and every night it paid out more than it took — always visible only afterwards.

Rule-Change Ledger

Its jackpot is one chance in 13,983,816 today — see every rule change that made it so, and by how much each one lengthened the odds.

Machine Room

Where a game publishes which drum and which set of balls drew it, each set is tested on its own here — the only place a physical fault could hide.

Calendar Court

Six ways of splitting the calendar — weekday, month, part of the month, holiday, slot, machine change — each asking whether this game's draws differ from the rest of their own history.

World Fairness Board

Every game this site holds, put through the same three fairness tests — this one among them, with a false-discovery pass across the whole board.

Regression Ledger

Replay this game from the start and record everything that ever passed 3.28 standard deviations — the threshold 49 numbers at once demands — then read what happened to it next.

Lottery Design Studio

Open the studio on this game’s own 6-from-49, then move one number and watch the 1-in-13,983,816 jackpot, the sum curve and the break-even prize move together.

Chance Detective

Three simulated machines. Which would you investigate?

The Headline Factory

Find a miracle in a fair archive, then count the searches that found it.

The Crowd Through Time

Does the estimated preference for birthday numbers change over time or with jackpots?

Thirty Years of Saturdays

One hypothetical routine, thousands of lives, and the full spread of outcomes.

Pattern Recipe Lab

Combine primes, squares, Fibonacci numbers and sums. Count how much of chance your recipe describes.

Arithmetic Progression Garden

Find equal steps and mirror pairs in history, then grow a fair comparison.

Same Odds, Different Waits

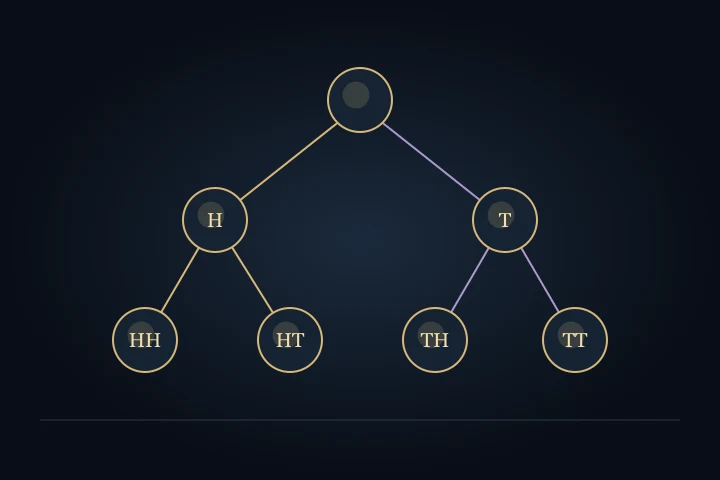
HH and HT each have a one-in-four chance in two flips. Why does one take longer to arrive?

Wrong Formula Lab

Give fair numbers the wrong baseline and watch an innocent pattern appear.

Euler’s Lottery Desk

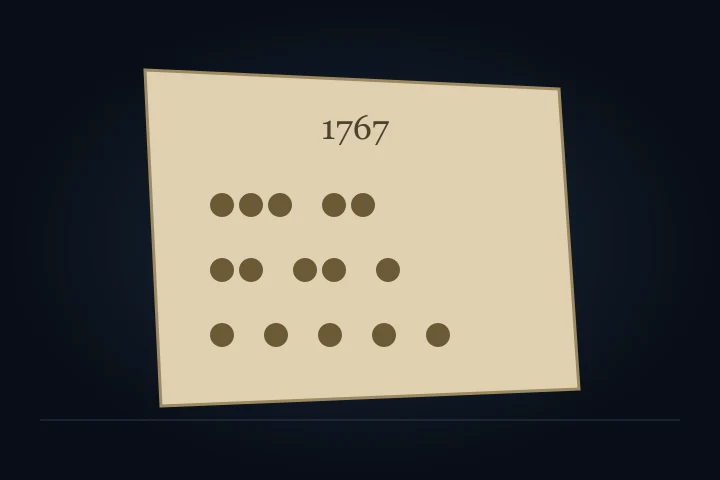
From a 1767 paper to every possible arrangement of consecutive runs.

Casanova’s Risky Treasury

A profitable lottery can still run out of money. Explore a fictional treasury inspired by history.

The Lottery That Chose Lives

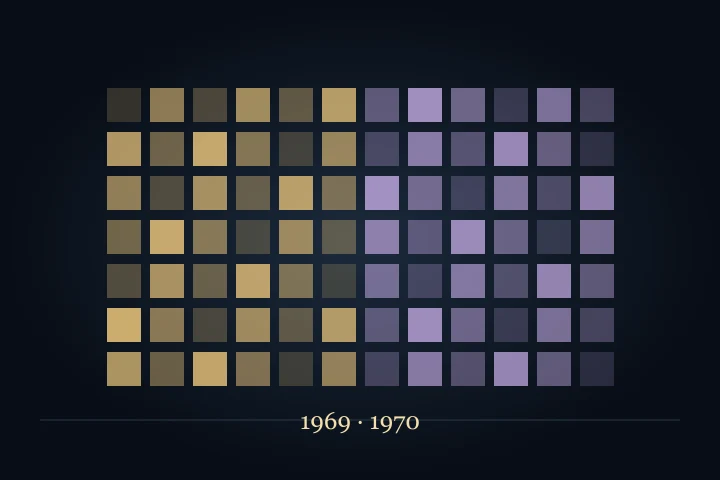
Read the 1969 and 1970 US draft drawings through their actual calendar ranks.

The Museum Built by Chance

A royal proposal, an annuity ticket and a national collection: three objects from lottery history.

Digit Laboratory

This is a without-replacement ball game; the Digit Laboratory is for Pick 3 and Pick 4.

Not for this game
Chernoff Map

The Chernoff Map reads the straight tier of a digit game, which counts tickets on one exact number; a ball game has no such row.

Not for this game

Balls versus RNG

This game draws once a day, so it has no second draw to compare its first with.

Not for this game

This draw, read by every tool

What the site’s explorations say about the numbers drawn on 10 October 2026 — each beside what chance predicted. None of it says anything about the next draw.

80oddordinary

How ordinary this draw is

Scored 80 of 100 across six shape features — more typical than about 99% of every possible ticket.

  • sum54th
  • odd48th
  • low48th
  • widest gap65th
  • neighbours70th
  • spread33th
Draw Fingerprints →

Each number, as it stood before this draw

Times drawn before — chance expected 214 of each

12205times
18203times
23237times
27217times
28222times
45243times

Every number was expected about that many times after 1,750 draws, and they scatter around it. Warm means more than expected, cool means fewer — and a cold number arriving is exactly what cold numbers do.

Frequency Explorer →

Its nearest twin

Shares 4 of 6 numbers (12, 23, 27, 45) with the draw of 17 September 2025 — its closest relative in 1,750 draws. Chance gave a match this close a 82% likelihood somewhere in that history.

From the draw just before (7 October 2026): nothing carried over. Chance says 56% of draws repeat at least one number.

Carry-over / Déjà Vu →

Sum and shape

153

The numbers add up to 153 — the 53th percentile of all possible tickets, around a middle of 150. Side-by-side numbers: 27–28. 50% of draws have at least one such pair.

Sum Distribution →

The longest wait in this draw

27 had not appeared for 9 draws. A number waits about 8 on average, and a wait this long was not a signal — the machine has no memory of it.

Gap & “Overdue” Tracker →

How many people held it

A line like this is played about 1.3× as often as an average ticket — more popular than most. At 30 million tickets sold, a winner on these numbers would keep about 35% of the jackpot.

Illustrative model, calibrated to published studies — not live sales.

The Unpopular Numbers Edge →


Prize breakdown · 2026-10-10

  • Lines in play≈ 4.7Mas the winner counts imply
  • Paid outCA$6.7Mto 708k winning lines
  • Won something1 in 7lines took a prize
  • Match 61 winnerchance said 0.34

Where the money went

  • Match 675%CA$5.0M
  • Match 44.6%CA$309.1K
  • Match 313%CA$841.6K
  • 3 other tiers7.9%CA$526.3K
Tier1101001k10k100k1MWinners1101001k10k100k1M10MPrize each
  1. Match 61≈ 0.34 by chanceCA$5,000,000
  2. Match 5 + Bonus1≈ 2.0 by chanceCA$182,983
  3. Match 581≈ 85 by chanceCA$949
  4. Match 44,513≈ 4.6k by chanceCA$68.50
  5. Match 2 + Bonus53,302≈ 58k by chanceCA$5.00
  6. Match 384,155≈ 83k by chanceCA$10.00
  7. Match 2566,130≈ 566k by chance—
  • Winners, log scale
  • Prize each, log scale
  • Where chance put the count

The rings take the ≈4.7M lines the counts imply and assume an evenly spread crowd. Furthest from that: Match 2 + Bonus — 53,302 winners, 8% fewer than the 58k an even spread gives. The real crowd and an even spread agreed closely on this draw.

Show the published table
MatchWinnersPrize each
Match 61CA$5,000,000
Match 5 + Bonus1CA$182,983
Match 581CA$949
Match 44,513CA$68.50
Match 384,155CA$10.00
Match 2 + Bonus53,302CA$5.00
Match 2566,130—

Jackpot

What the top prize has been, draw by draw. It climbs while nobody wins and drops to the floor when somebody does — the sawtooth every rollover game draws.

Rolling now
0 draws
Typical wait
2.2 draws
Longest run
11
11 draws, 2015-09-09 to 2015-10-17
Highest reached
CA$64,000,000
CA$10M2011-09-07 — CA$7,277,628 won2011-09-24 — CA$21,071,871 won2011-09-28 — CA$3,377,345 won2011-10-05 — CA$7,702,263 won2011-10-15 — CA$12,898,519 won2011-10-22 — CA$8,273,712 won2011-10-26 — CA$3,829,543 won2011-11-16 — CA$30,000,000 won2011-11-26 — CA$11,790,541 won2011-12-07 — CA$11,810,088 won2011-12-14 — CA$7,420,259 won2011-12-31 — CA$22,442,363 won2012-01-21 — CA$24,907,026 won2012-01-25 — CA$3,436,261 won2012-01-28 — CA$1,845,845 won2012-02-11 — CA$15,574,780 won2012-02-15 — CA$3,301,611 won2012-02-25 — CA$11,521,899 won2012-02-29 — CA$3,000,000 won2012-03-03 — CA$4,032,657 won2012-03-14 — CA$12,006,715 won2012-03-21 — CA$7,918,116 won2012-03-28 — CA$7,845,281 won2012-04-07 — CA$12,956,563 won2012-04-11 — CA$3,237,123 won2012-04-25 — CA$15,780,924 won2012-05-12 — CA$21,405,059 won2012-06-02 — CA$25,492,252 won2012-06-06 — CA$3,557,161 won2012-06-30 — CA$32,388,978 won2012-07-07 — CA$7,266,294 won2012-07-18 — CA$10,998,365 won2012-08-11 — CA$30,663,650 won2012-08-15 — CA$3,000,000 won2012-08-22 — CA$6,868,101 won2012-08-29 — CA$3,336,623 won2012-09-01 — CA$3,721,678 won2012-09-08 — CA$7,140,631 won2012-09-15 — CA$7,417,295 won2012-09-19 — CA$1,624,352 won2012-09-22 — CA$3,781,468 won2012-09-26 — CA$3,294,730 won2012-10-10 — CA$15,886,262 won2012-10-13 — CA$3,592,223 won2012-11-14 — CA$45,677,261 won2012-11-21 — CA$7,652,677 won2012-12-08 — CA$21,254,833 won2012-12-12 — CA$3,396,966 won2012-12-15 — CA$3,627,485 won2012-12-29 — CA$15,546,830 won2013-01-02 — CA$3,463,164 won2013-01-16 — CA$15,689,036 won2013-01-19 — CA$3,316,843 won2013-01-23 — CA$3,000,000 won2013-01-26 — CA$3,544,149 won2013-02-06 — CA$11,062,988 won2013-02-09 — CA$3,793,035 won2013-03-02 — CA$30,000,000 won2013-03-09 — CA$7,019,743 won2013-04-13 — CA$63,413,885 won2013-04-27 — CA$17,443,274 won2013-05-11 — CA$17,026,624 won2013-05-15 — CA$3,226,612 won2013-05-25 — CA$11,615,207 won2013-05-29 — CA$3,351,961 won2013-06-05 — CA$7,111,226 won2013-06-19 — CA$15,222,777 won2013-07-06 — CA$19,733,071 won2013-07-10 — CA$3,000,000 won2013-07-20 — CA$11,062,890 won2013-07-24 — CA$3,000,000 won2013-07-31 — CA$7,036,047 won2013-08-03 — CA$3,367,704 won2013-08-10 — CA$6,858,653 won2013-08-14 — CA$3,197,183 won2013-08-17 — CA$3,377,005 won2013-08-31 — CA$14,797,843 won2013-09-14 — CA$14,892,205 won2013-10-12 — CA$40,000,000 won2013-10-30 — CA$20,223,182 won2013-11-16 — CA$20,113,059 won2013-12-04 — CA$19,094,241 won2013-12-07 — CA$5,000,000 won2013-12-14 — CA$7,159,544 won2013-12-28 — CA$16,383,989 won2014-01-01 — CA$5,000,000 won2014-01-04 — CA$5,000,000 won2014-01-08 — CA$5,000,000 won2014-01-11 — CA$5,000,000 won2014-01-22 — CA$10,380,999 won2014-02-01 — CA$11,031,692 won2014-02-19 — CA$17,356,813 won2014-02-26 — CA$7,000,000 won2014-03-05 — CA$7,247,826 won2014-03-22 — CA$18,799,378 won2014-04-02 — CA$10,846,571 won2014-04-09 — CA$7,000,000 won2014-04-26 — CA$17,883,530 won2014-05-03 — CA$7,000,000 won2014-05-14 — CA$9,985,307 won2014-05-21 — CA$7,000,000 won2014-06-04 — CA$13,972,984 won2014-06-07 — CA$5,000,000 won2014-06-25 — CA$18,397,959 won2014-06-28 — CA$5,000,000 won2014-07-12 — CA$13,216,947 won2014-07-19 — CA$7,000,000 won2014-08-02 — CA$13,688,924 won2014-08-06 — CA$5,000,000 won2014-08-16 — CA$10,395,606 won2014-08-20 — CA$5,000,000 won2014-08-27 — CA$7,000,000 won2014-08-30 — CA$5,000,000 won2014-09-10 — CA$9,225,610 won2014-09-13 — CA$5,000,000 won2014-09-17 — CA$5,000,000 won2014-10-01 — CA$13,805,045 won2014-10-18 — CA$20,000,000 won2014-11-01 — CA$13,640,139 won2014-11-05 — CA$5,000,000 won2014-12-03 — CA$29,981,864 won2014-12-10 — CA$7,000,000 won2014-12-17 — CA$7,038,734 won2014-12-20 — CA$5,000,000 won2015-01-17 — CA$35,164,526 won2015-01-21 — CA$5,000,000 won2015-01-31 — CA$10,052,203 won2015-02-14 — CA$13,888,226 won2015-02-18 — CA$5,000,000 won2015-02-21 — CA$5,000,000 won2015-02-25 — CA$5,000,000 won2015-02-28 — CA$5,000,000 won2015-03-04 — CA$5,000,000 won2015-04-01 — CA$34,967,875 won2015-04-11 — CA$10,584,398 won2015-05-06 — CA$27,523,073 won2015-05-09 — CA$5,000,000 won2015-05-20 — CA$9,707,953 won2015-05-30 — CA$10,188,760 won2015-06-17 — CA$17,368,141 won2015-07-22 — CA$41,064,048 won2015-08-05 — CA$14,200,838 won2015-08-22 — CA$18,105,802 won2015-08-29 — CA$7,000,000 won2015-09-05 — CA$7,000,000 won2015-10-17 — CA$64,000,000 won2015-11-07 — CA$24,518,435 won2015-11-11 — CA$5,000,000 won2015-11-28 — CA$19,643,389 won2015-12-12 — CA$14,519,825 won2016-01-02 — CA$23,846,591 won2016-01-09 — CA$7,034,293 won2016-01-13 — CA$5,000,000 won2016-01-30 — CA$18,308,200 won2016-02-20 — CA$21,927,453 won2016-02-27 — CA$7,240,871 won2016-03-12 — CA$13,259,789 won2016-03-19 — CA$7,000,000 won2016-03-23 — CA$5,000,000 won2016-04-06 — CA$12,985,186 won2016-04-09 — CA$5,000,000 won2016-04-30 — CA$20,997,903 won2016-05-04 — CA$5,000,000 won2016-05-18 — CA$13,238,371 won2016-05-28 — CA$9,824,874 won2016-06-04 — CA$7,000,000 won2016-06-18 — CA$12,803,468 won2016-06-25 — CA$7,000,000 won2016-07-06 — CA$9,383,663 won2016-07-13 — CA$7,000,000 won2016-07-16 — CA$5,000,000 won2016-07-20 — CA$5,000,000 won2016-07-23 — CA$5,000,000 won2016-08-13 — CA$21,054,566 won2016-08-27 — CA$13,612,423 won2016-08-31 — CA$5,000,000 won2016-09-03 — CA$5,000,000 won2016-09-07 — CA$5,000,000 won2016-09-17 — CA$9,714,091 won2016-10-08 — CA$20,531,313 won2016-11-09 — CA$32,707,357 won2016-12-03 — CA$24,743,962 won2016-12-07 — CA$5,000,000 won2016-12-17 — CA$9,814,798 won2016-12-28 — CA$10,733,410 won2017-01-21 — CA$25,000,000 won2017-02-04 — CA$12,885,936 won2017-02-22 — CA$16,326,122 won2017-02-25 — CA$5,000,000 won2017-03-04 — CA$7,000,000 won2017-03-11 — CA$7,000,000 won2017-03-25 — CA$12,243,922 won2017-04-01 — CA$7,000,000 won2017-04-12 — CA$9,359,345 won2017-05-10 — CA$30,000,000 won2017-05-24 — CA$12,715,949 won2017-06-14 — CA$22,000,000 won2017-06-28 — CA$12,741,160 won2017-07-08 — CA$9,576,382 won2017-07-12 — CA$5,000,000 won2017-07-15 — CA$5,000,000 won2017-07-19 — CA$5,000,000 won2017-07-29 — CA$9,524,396 won2017-08-12 — CA$12,875,586 won2017-08-19 — CA$7,000,000 won2017-08-23 — CA$7,000,000 won2017-09-06 — CA$16,042,016 won2017-09-20 — CA$12,293,435 won2017-09-23 — CA$5,000,000 won2017-10-28 — CA$40,497,950 won2017-11-04 — CA$7,000,000 won2017-11-22 — CA$16,787,681 won2017-11-25 — CA$5,000,000 won2017-11-29 — CA$5,000,000 won2017-12-06 — CA$7,000,000 won2017-12-23 — CA$17,281,744 won2017-12-27 — CA$5,000,000 won2017-12-30 — CA$5,000,000 won2018-01-03 — CA$5,000,000 won2018-01-27 — CA$23,324,912 won2018-02-07 — CA$9,000,000 won2018-02-14 — CA$7,039,870 won2018-02-28 — CA$12,506,188 won2018-03-21 — CA$20,481,126 won2018-03-28 — CA$7,000,000 won2018-04-25 — CA$30,531,740 won2018-05-16 — CA$21,970,313 won2018-05-19 — CA$5,000,000 won2018-05-30 — CA$9,684,326 won2018-06-09 — CA$9,785,891 won2018-06-16 — CA$7,000,000 won2018-06-23 — CA$7,000,000 won2018-06-30 — CA$7,000,000 won2018-07-11 — CA$9,333,581 won2018-07-25 — CA$12,232,913 won2018-07-28 — CA$5,000,000 won2018-08-29 — CA$33,600,463 won2018-10-03 — CA$40,000,000 won2018-10-10 — CA$7,000,000 won2018-10-13 — CA$5,000,000 won2018-10-20 — CA$7,000,000 won2018-10-24 — CA$5,000,000 won2018-11-03 — CA$9,656,932 won2018-11-07 — CA$5,000,000 won2018-11-28 — CA$19,813,534 won2018-12-15 — CA$15,871,973 won2019-01-02 — CA$16,319,280 won2019-02-02 — CA$33,396,099 won2019-02-06 — CA$5,000,000 won2019-02-09 — CA$5,000,000 won2019-02-13 — CA$5,000,000 won2019-02-27 — CA$13,345,152 won2019-03-20 — CA$22,000,000 won2019-03-23 — CA$5,000,000 won2019-04-03 — CA$10,150,393 won2019-04-06 — CA$5,000,000 won2019-04-20 — CA$13,454,892 won2019-04-27 — CA$7,000,000 won2019-05-15 — CA$15,752,666 won2019-06-15 — CA$29,801,647 won2019-07-03 — CA$15,764,627 won2019-07-10 — CA$7,000,000 won2019-07-20 — CA$9,136,367 won2019-07-31 — CA$9,000,000 won2019-08-07 — CA$7,000,000 won2019-08-17 — CA$9,000,000 won2019-08-21 — CA$5,000,000 won2019-08-31 — CA$9,000,000 won2019-09-04 — CA$5,000,000 won2019-09-07 — CA$5,000,000 won2019-09-11 — CA$5,000,000 won2019-10-09 — CA$25,470,952 won2019-10-16 — CA$7,000,000 won2019-10-19 — CA$5,000,000 won2019-11-09 — CA$18,172,995 won2019-11-30 — CA$17,613,060 won2019-12-04 — CA$5,000,000 won2019-12-14 — CA$9,000,000 won2020-01-08 — CA$25,127,626 won2020-01-11 — CA$5,000,000 won2020-01-18 — CA$7,000,000 won2020-01-29 — CA$9,000,000 won2020-02-08 — CA$9,053,760 won2020-02-12 — CA$5,000,000 won2020-02-19 — CA$7,000,000 won2020-02-22 — CA$5,000,000 won2020-03-07 — CA$11,436,313 won2020-03-18 — CA$9,000,000 won2020-04-15 — CA$16,460,053 won2020-04-22 — CA$6,000,000 won2020-05-27 — CA$24,369,459 won2020-06-03 — CA$6,000,000 won2020-06-24 — CA$16,058,553 won2020-07-01 — CA$6,000,000 won2020-07-22 — CA$17,078,167 won2020-07-25 — CA$5,000,000 won2020-08-15 — CA$17,405,149 won2020-08-22 — CA$6,000,000 won2020-09-12 — CA$18,243,991 won2020-09-16 — CA$5,000,000 won2020-09-26 — CA$8,435,999 won2020-09-30 — CA$5,000,000 won2020-10-07 — CA$6,000,000 won2020-10-24 — CA$14,250,816 won2020-10-31 — CA$6,000,000 won2020-11-18 — CA$14,061,516 won2020-12-19 — CA$28,936,318 won2020-12-30 — CA$9,342,569 won2021-01-09 — CA$8,730,601 won2021-01-13 — CA$5,000,000 won2021-01-23 — CA$8,493,123 won2021-02-10 — CA$15,035,009 won2021-02-13 — CA$5,000,000 won2021-03-13 — CA$27,146,340 won2021-03-20 — CA$6,000,000 won2021-04-14 — CA$22,802,555 won2021-05-12 — CA$27,505,450 won2021-05-22 — CA$8,874,167 won2021-05-29 — CA$6,000,000 won2021-06-02 — CA$5,000,000 won2021-06-12 — CA$9,440,109 won2021-06-19 — CA$6,000,000 won2021-07-10 — CA$18,680,004 won2021-07-17 — CA$6,000,000 won2021-07-24 — CA$6,000,000 won2021-08-14 — CA$20,000,000 won2021-08-28 — CA$10,990,459 won2021-09-22 — CA$21,185,218 won2021-10-06 — CA$11,580,840 won2021-10-20 — CA$10,255,030 won2021-11-10 — CA$16,511,291 won2021-11-20 — CA$7,520,901 won2021-11-24 — CA$5,000,000 won2021-12-04 — CA$8,838,895 won2022-01-12 — CA$36,449,853 won2022-01-29 — CA$14,205,913 won2022-02-02 — CA$5,000,000 won2022-02-26 — CA$21,593,704 won2022-03-09 — CA$8,068,948 won2022-03-16 — CA$6,000,000 won2022-04-06 — CA$18,784,770 won2022-04-16 — CA$8,601,730 won2022-04-30 — CA$11,036,139 won2022-05-14 — CA$11,205,427 won2022-05-28 — CA$10,968,528 won2022-06-04 — CA$6,000,000 won2022-06-15 — CA$7,682,546 won2022-07-09 — CA$20,000,000 won2022-07-30 — CA$17,183,707 won2022-08-06 — CA$6,000,000 won2022-08-27 — CA$15,686,468 won2022-09-10 — CA$10,600,886 won2022-09-17 — CA$5,000,000 won2022-10-01 — CA$5,000,000 won2022-10-05 — CA$5,000,000 won2022-10-12 — CA$5,000,000 won2022-10-22 — CA$5,000,000 won2022-10-26 — CA$5,000,000 won2022-10-29 — CA$5,000,000 won2022-12-03 — CA$5,000,000 won2022-12-21 — CA$5,000,000 won2022-12-28 — CA$5,000,000 won2022-12-31 — CA$5,000,000 won2023-01-04 — CA$5,000,000 won2023-01-07 — CA$5,000,000 won2023-01-11 — CA$5,000,000 won2023-02-01 — CA$5,000,000 won2023-02-04 — CA$5,000,000 won2023-03-01 — CA$5,000,000 won2023-03-11 — CA$5,000,000 won2023-03-29 — CA$5,000,000 won2023-04-08 — CA$5,000,000 won2023-04-15 — CA$5,000,000 won2023-04-22 — CA$5,000,000 won2023-04-29 — CA$5,000,000 won2023-05-06 — CA$5,000,000 won2023-05-17 — CA$5,000,000 won2023-05-20 — CA$5,000,000 won2023-06-14 — CA$5,000,000 won2023-06-17 — CA$5,000,000 won2023-07-01 — CA$5,000,000 won2023-07-19 — CA$5,000,000 won2023-08-12 — CA$5,000,000 won2023-08-16 — CA$5,000,000 won2023-08-23 — CA$5,000,000 won2023-09-02 — CA$5,000,000 won2023-09-16 — CA$5,000,000 won2023-09-20 — CA$5,000,000 won2023-09-23 — CA$5,000,000 won2023-09-27 — CA$5,000,000 won2023-09-30 — CA$5,000,000 won2023-10-04 — CA$5,000,000 won2023-10-21 — CA$5,000,000 won2023-11-08 — CA$5,000,000 won2023-11-18 — CA$5,000,000 won2023-11-29 — CA$5,000,000 won2023-12-09 — CA$5,000,000 won2023-12-23 — CA$5,000,000 won2024-01-20 — CA$5,000,000 won2024-01-27 — CA$5,000,000 won2024-02-21 — CA$5,000,000 won2024-02-24 — CA$5,000,000 won2024-02-28 — CA$5,000,000 won2024-03-02 — CA$5,000,000 won2024-03-06 — CA$5,000,000 won2024-03-09 — CA$5,000,000 won2024-03-20 — CA$5,000,000 won2024-04-03 — CA$5,000,000 won2024-04-13 — CA$5,000,000 won2024-04-24 — CA$5,000,000 won2024-05-04 — CA$5,000,000 won2024-05-08 — CA$5,000,000 won2024-05-11 — CA$5,000,000 won2024-05-25 — CA$5,000,000 won2024-06-01 — CA$5,000,000 won2024-06-15 — CA$5,000,000 won2024-06-26 — CA$5,000,000 won2024-06-29 — CA$5,000,000 won2024-07-03 — CA$5,000,000 won2024-07-20 — CA$5,000,000 won2024-08-14 — CA$5,000,000 won2024-08-21 — CA$5,000,000 won2024-08-28 — CA$5,000,000 won2024-09-11 — CA$5,000,000 won2024-09-18 — CA$5,000,000 won2024-09-28 — CA$5,000,000 won2024-10-09 — CA$5,000,000 won2024-10-12 — CA$5,000,000 won2024-11-13 — CA$5,000,000 won2024-12-07 — CA$5,000,000 won2024-12-14 — CA$5,000,000 won2024-12-18 — CA$5,000,000 won2024-12-21 — CA$5,000,000 won2024-12-28 — CA$5,000,000 won2025-02-05 — CA$5,000,000 won2025-03-05 — CA$5,000,000 won2025-03-08 — CA$5,000,000 won2025-03-19 — CA$5,000,000 won2025-03-22 — CA$5,000,000 won2025-03-26 — CA$5,000,000 won2025-04-02 — CA$5,000,000 won2025-04-05 — CA$5,000,000 won2025-04-16 — CA$5,000,000 won2025-04-23 — CA$5,000,000 won2025-04-26 — CA$5,000,000 won2025-05-07 — CA$5,000,000 won2025-06-04 — CA$5,000,000 won2025-06-11 — CA$5,000,000 won2025-06-18 — CA$5,000,000 won2025-06-21 — CA$5,000,000 won2025-06-25 — CA$5,000,000 won2025-07-02 — CA$5,000,000 won2025-07-09 — CA$5,000,000 won2025-08-06 — CA$5,000,000 won2025-08-27 — CA$5,000,000 won2025-09-06 — CA$5,000,000 won2025-09-10 — CA$5,000,000 won2025-09-27 — CA$28,000,000 won2025-10-08 — CA$34,000,000 won2025-10-15 — CA$10,000,000 won2025-10-25 — CA$16,000,000 won2025-10-29 — CA$18,000,000 won2025-11-05 — CA$22,000,000 won2025-12-03 — CA$38,000,000 won2025-12-06 — CA$40,000,000 won2025-12-10 — CA$42,000,000 won2025-12-13 — CA$44,000,000 won2025-12-20 — CA$10,000,000 won2025-12-31 — CA$16,000,000 won2026-01-07 — CA$10,000,000 won2026-01-17 — CA$16,000,000 won2026-01-28 — CA$22,000,000 won2026-01-31 — CA$24,000,000 won2026-02-04 — CA$26,000,000 won2026-02-18 — CA$34,000,000 won2026-02-21 — CA$36,000,000 won2026-03-04 — CA$42,000,000 won2026-03-11 — CA$10,000,000 won2026-04-01 — CA$22,000,000 won2026-04-22 — CA$34,000,000 won2026-04-29 — CA$5,000,000 won2026-05-02 — CA$5,000,000 won2026-05-16 — CA$5,000,000 won2026-05-20 — CA$5,000,000 won2026-05-27 — CA$16,000,000 won2026-08-05 — CA$44,000,000 won2026-08-08 — CA$10,000,000 won2026-08-26 — CA$5,000,000 won2026-09-23 — CA$5,000,000 won2026-10-10 — CA$5,000,000 won2011-09-072026-10-10Advertised jackpot

The jackpot has gone 0 draws without a winner. The typical wait here is 2.2 draws.

How long the waits are

0
1
2
3
4
5
6
7
8
9
10+

Happenedwhat chance predicts

Completed waits between wins, against the geometric law those waits follow if every draw is an independent chance at the jackpot. The law takes its one parameter from the waits themselves, so this compares shape, not level.

Recent draws

Open any draw to read it by every tool — the same six readings the latest result gets above, each against what chance predicted at the time.

Browse every month →1,751 draws on record, Saturday, 2 January 2010 to Saturday, 10 October 2026.
DateNumbersConfidence
  • 2026-10-10
    1. 12
    2. 18
    3. 23
    4. 27
    5. 28
    6. 45
    7. 32
    Single sourceRead

    SourcesOnly Primary (commercial feed) reported this draw, so there is nothing to check it against. Settled 11 Oct 2026, 12:23 UTC.

    • Primarycommercial feed12 18 23 27 28 45 + 3211 Oct 2026, 12:23 UTC
    80oddordinary

    How ordinary this draw is

    Scored 80 of 100 across six shape features — more typical than about 99% of every possible ticket.

    • sum54th
    • odd48th
    • low48th
    • widest gap65th
    • neighbours70th
    • spread33th
    Draw Fingerprints →

    Each number, as it stood before this draw

    Times drawn before — chance expected 214 of each

    12205times
    18203times
    23237times
    27217times
    28222times
    45

    Play these numbers? Read them as your ticket →

  • 2026-10-07
    1. 3
    2. 8
    3. 11
    4. 20
    5. 33
    6. 49
    7. 14
    Single sourceRead

    SourcesOnly Primary (commercial feed) reported this draw, so there is nothing to check it against. Settled 8 Oct 2026, 04:32 UTC.

    • Primarycommercial feed3 8 11 20 33 49 + 1411 Oct 2026, 12:23 UTC

    Play these numbers? Read them as your ticket →

  • 2026-10-03
    1. 1
    2. 4
    3. 7
    4. 23
    5. 28
    6. 37
    7. 38
    Single sourceRead

    SourcesOnly Primary (commercial feed) reported this draw, so there is nothing to check it against. Settled 4 Oct 2026, 23:35 UTC.

    • Primarycommercial feed1 4 7 23 28 37 + 3811 Oct 2026, 12:23 UTC

    Play these numbers? Read them as your ticket →

  • 2026-09-30
    1. 4
    2. 9
    3. 12
    4. 39
    5. 43
    6. 46
    7. 28
    Single sourceRead

    SourcesOnly Primary (commercial feed) reported this draw, so there is nothing to check it against. Settled 1 Oct 2026, 16:01 UTC.

    • Primarycommercial feed4 9 12 39 43 46 + 2811 Oct 2026, 12:23 UTC

    Play these numbers? Read them as your ticket →

  • 2026-09-26
    1. 11
    2. 12
    3. 18
    4. 19
    5. 45
    6. 46
    7. 38
    Single sourceRead

    SourcesOnly Primary (commercial feed) reported this draw, so there is nothing to check it against. Settled 27 Sept 2026, 05:50 UTC.

    • Primarycommercial feed11 12 18 19 45 46 + 3811 Oct 2026, 12:23 UTC

    Play these numbers? Read them as your ticket →

  • 2026-09-23
    1. 11
    2. 20
    3. 32
    4. 35
    5. 38
    6. 45
    7. 9
    Single sourceRead

    SourcesOnly Primary (commercial feed) reported this draw, so there is nothing to check it against. Settled 24 Sept 2026, 11:55 UTC.

    • Primarycommercial feed11 20 32 35 38 45 + 911 Oct 2026, 12:23 UTC

    Play these numbers? Read them as your ticket →

  • 2026-09-19
    1. 1
    2. 4
    3. 13
    4. 18
    5. 25
    6. 42
    7. 29
    Single sourceRead

    SourcesOnly Primary (commercial feed) reported this draw, so there is nothing to check it against. Settled 20 Sept 2026, 04:30 UTC.

    • Primarycommercial feed1 4 13 18 25 42 + 2911 Oct 2026, 12:23 UTC

    Play these numbers? Read them as your ticket →

  • 2026-09-16
    1. 3
    2. 5
    3. 19
    4. 32
    5. 46
    6. 48
    7. 9
    Single sourceRead

    SourcesOnly Primary (commercial feed) reported this draw, so there is nothing to check it against. Settled 17 Sept 2026, 11:40 UTC.

    • Primarycommercial feed3 5 19 32 46 48 + 911 Oct 2026, 12:23 UTC

    Play these numbers? Read them as your ticket →

  • 2026-09-12
    1. 1
    2. 3
    3. 17
    4. 20
    5. 26
    6. 32
    7. 5
    Single sourceRead

    SourcesOnly Primary (commercial feed) reported this draw, so there is nothing to check it against. Settled 13 Sept 2026, 04:15 UTC.

    • Primarycommercial feed1 3 17 20 26 32 + 511 Oct 2026, 12:23 UTC

    Play these numbers? Read them as your ticket →

  • 2026-09-09
    1. 14
    2. 18
    3. 27
    4. 35
    5. 41
    6. 47
    7. 17
    Single sourceRead

    SourcesOnly Primary (commercial feed) reported this draw, so there is nothing to check it against. Settled 10 Sept 2026, 17:25 UTC.

    • Primarycommercial feed14 18 27 35 41 47 + 1711 Oct 2026, 12:23 UTC

    Play these numbers? Read them as your ticket →

  • 2026-09-05
    1. 5
    2. 10
    3. 17
    4. 34
    5. 42
    6. 49
    7. 44
    Single sourceRead

    SourcesOnly Primary (commercial feed) reported this draw, so there is nothing to check it against. Settled 6 Sept 2026, 11:50 UTC.

    • Primarycommercial feed5 10 17 34 42 49 + 4411 Oct 2026, 12:23 UTC

    Play these numbers? Read them as your ticket →

  • 2026-09-02
    1. 6
    2. 8
    3. 9
    4. 14
    5. 17
    6. 25
    7. 16
    Single sourceRead

    SourcesOnly Primary (commercial feed) reported this draw, so there is nothing to check it against. Settled 3 Sept 2026, 12:40 UTC.

    • Primarycommercial feed6 8 9 14 17 25 + 1611 Oct 2026, 12:23 UTC

    Play these numbers? Read them as your ticket →

Show the numbers
Draws waitedHappenedChance says
0147155.0
197106.2
27872.7
35349.8
43634.1
53223.4
61816.0
71511.0
877.5
965.1
10+311.2
243times

Every number was expected about that many times after 1,750 draws, and they scatter around it. Warm means more than expected, cool means fewer — and a cold number arriving is exactly what cold numbers do.

Frequency Explorer →

Its nearest twin

Shares 4 of 6 numbers (12, 23, 27, 45) with the draw of 17 September 2025 — its closest relative in 1,750 draws. Chance gave a match this close a 82% likelihood somewhere in that history.

From the draw just before (7 October 2026): nothing carried over. Chance says 56% of draws repeat at least one number.

Carry-over / Déjà Vu →

Sum and shape

153

The numbers add up to 153 — the 53th percentile of all possible tickets, around a middle of 150. Side-by-side numbers: 27–28. 50% of draws have at least one such pair.

Sum Distribution →

The longest wait in this draw

27 had not appeared for 9 draws. A number waits about 8 on average, and a wait this long was not a signal — the machine has no memory of it.

Gap & “Overdue” Tracker →

How many people held it

A line like this is played about 1.3× as often as an average ticket — more popular than most. At 30 million tickets sold, a winner on these numbers would keep about 35% of the jackpot.

Illustrative model, calibrated to published studies — not live sales.

The Unpopular Numbers Edge →
47oddordinary

How ordinary this draw is

Scored 47 of 100 across six shape features — more typical than about 36% of every possible ticket.

  • sum22th
  • odd77th
  • low77th
  • widest gap58th
  • neighbours25th
  • spread95th
Draw Fingerprints →

Each number, as it stood before this draw

Times drawn before — chance expected 214 of each

3226times
8218times
11216times
20213times
33210times
49219times

Every number was expected about that many times after 1,749 draws, and they scatter around it. Warm means more than expected, cool means fewer — and a cold number arriving is exactly what cold numbers do.

Frequency Explorer →

Its nearest twin

Shares 4 of 6 numbers (11, 20, 33, 49) with the draw of 12 June 2021 — its closest relative in 1,749 draws. Chance gave a match this close a 82% likelihood somewhere in that history.

From the draw just before (3 October 2026): nothing carried over. Chance says 56% of draws repeat at least one number.

Carry-over / Déjà Vu →

Sum and shape

124

The numbers add up to 124 — the 21th percentile of all possible tickets, around a middle of 150. No two numbers side by side. 50% of draws have at least one such pair.

Sum Distribution →

The longest wait in this draw

33 had not appeared for 11 draws. A number waits about 8 on average, and a wait this long was not a signal — the machine has no memory of it.

Gap & “Overdue” Tracker →

How many people held it

A line like this is played about 1.4× as often as an average ticket — more popular than most. At 30 million tickets sold, a winner on these numbers would keep about 32% of the jackpot.

Illustrative model, calibrated to published studies — not live sales.

The Unpopular Numbers Edge →

55oddordinary

How ordinary this draw is

Scored 55 of 100 across six shape features — more typical than about 58% of every possible ticket.

  • sum6th
  • odd77th
  • low77th
  • widest gap58th
  • neighbours25th
  • spread47th
Draw Fingerprints →

Each number, as it stood before this draw

Times drawn before — chance expected 214 of each

1176times
4222times
7224times
23236times
28221times
37216times

Every number was expected about that many times after 1,748 draws, and they scatter around it. Warm means more than expected, cool means fewer — and a cold number arriving is exactly what cold numbers do.

Frequency Explorer →

Its nearest twin

Shares 4 of 6 numbers (4, 7, 28, 37) with the draw of 2 May 2018 — its closest relative in 1,748 draws. Chance gave a match this close a 82% likelihood somewhere in that history.

From the draw just before (30 September 2026): 4 carried over. Chance says 56% of draws repeat at least one number.

Carry-over / Déjà Vu →

Sum and shape

100

The numbers add up to 100 — the 6th percentile of all possible tickets, around a middle of 150. No two numbers side by side. 50% of draws have at least one such pair.

Sum Distribution →

The longest wait in this draw

37 had not appeared for 18 draws. A number waits about 8 on average, and a wait this long was not a signal — the machine has no memory of it.

Gap & “Overdue” Tracker →

How many people held it

A line like this is played about 1.7× as often as an average ticket — more popular than most. At 30 million tickets sold, a winner on these numbers would keep about 26% of the jackpot.

Illustrative model, calibrated to published studies — not live sales.

The Unpopular Numbers Edge →

64oddordinary

How ordinary this draw is

Scored 64 of 100 across six shape features — more typical than about 80% of every possible ticket.

  • sum54th
  • odd48th
  • low48th
  • widest gap97th
  • neighbours25th
  • spread78th
Draw Fingerprints →

Each number, as it stood before this draw

Times drawn before — chance expected 214 of each

4221times
9232times
12204times
39209times
43199times
46216times

Every number was expected about that many times after 1,747 draws, and they scatter around it. Warm means more than expected, cool means fewer — and a cold number arriving is exactly what cold numbers do.

Frequency Explorer →

Its nearest twin

Shares 4 of 6 numbers (4, 12, 39, 46) with the draw of 21 August 2013 — its closest relative in 1,747 draws. Chance gave a match this close a 82% likelihood somewhere in that history.

From the draw just before (26 September 2026): 12, 46 carried over. Chance says 56% of draws repeat at least one number.

Carry-over / Déjà Vu →

Sum and shape

153

The numbers add up to 153 — the 53th percentile of all possible tickets, around a middle of 150. No two numbers side by side. 50% of draws have at least one such pair.

Sum Distribution →

The longest wait in this draw

39 had not appeared for 32 draws. A number waits about 8 on average, and a wait this long was not a signal — the machine has no memory of it.

Gap & “Overdue” Tracker →

How many people held it

A line like this is played about 0.8× as often as an average ticket — less popular than most. At 30 million tickets sold, a winner on these numbers would keep about 47% of the jackpot.

Illustrative model, calibrated to published studies — not live sales.

The Unpopular Numbers Edge →

55oddordinary

How ordinary this draw is

Scored 55 of 100 across six shape features — more typical than about 58% of every possible ticket.

  • sum51th
  • odd48th
  • low77th
  • widest gap96th
  • neighbours99th
  • spread42th
Draw Fingerprints →

Each number, as it stood before this draw

Times drawn before — chance expected 214 of each

11215times
12203times
18202times
19198times
45242times
46215times

Every number was expected about that many times after 1,746 draws, and they scatter around it. Warm means more than expected, cool means fewer — and a cold number arriving is exactly what cold numbers do.

Frequency Explorer →

Its nearest twin

Shares 4 of 6 numbers (11, 18, 19, 46) with the draw of 29 May 2021 — its closest relative in 1,746 draws. Chance gave a match this close a 82% likelihood somewhere in that history.

From the draw just before (23 September 2026): 11, 45 carried over. Chance says 56% of draws repeat at least one number.

Carry-over / Déjà Vu →

Sum and shape

151

The numbers add up to 151 — the 51th percentile of all possible tickets, around a middle of 150. Side-by-side numbers: 11–12, 18–19, 45–46. 50% of draws have at least one such pair.

Sum Distribution →

The longest wait in this draw

12 had not appeared for 15 draws. A number waits about 8 on average, and a wait this long was not a signal — the machine has no memory of it.

Gap & “Overdue” Tracker →

How many people held it

A line like this is played about 1.0× as often as an average ticket — about as popular as most. At 30 million tickets sold, a winner on these numbers would keep about 42% of the jackpot.

Illustrative model, calibrated to published studies — not live sales.

The Unpopular Numbers Edge →
58oddordinary

How ordinary this draw is

Scored 58 of 100 across six shape features — more typical than about 65% of every possible ticket.

  • sum82th
  • odd48th
  • low20th
  • widest gap26th
  • neighbours25th
  • spread37th
Draw Fingerprints →

Each number, as it stood before this draw

Times drawn before — chance expected 214 of each

11214times
20212times
32183times
35222times
38230times
45241times

Every number was expected about that many times after 1,745 draws, and they scatter around it. Warm means more than expected, cool means fewer — and a cold number arriving is exactly what cold numbers do.

Frequency Explorer →

Its nearest twin

Shares 4 of 6 numbers (11, 20, 38, 45) with the draw of 27 May 2023 — its closest relative in 1,745 draws. Chance gave a match this close a 82% likelihood somewhere in that history.

From the draw just before (19 September 2026): nothing carried over. Chance says 56% of draws repeat at least one number.

Carry-over / Déjà Vu →

Sum and shape

181

The numbers add up to 181 — the 82th percentile of all possible tickets, around a middle of 150. No two numbers side by side. 50% of draws have at least one such pair.

Sum Distribution →

The longest wait in this draw

38 had not appeared for 20 draws. A number waits about 8 on average, and a wait this long was not a signal — the machine has no memory of it.

Gap & “Overdue” Tracker →

How many people held it

A line like this is played about 0.5× as often as an average ticket — less popular than most. At 30 million tickets sold, a winner on these numbers would keep about 64% of the jackpot.

Illustrative model, calibrated to published studies — not live sales.

The Unpopular Numbers Edge →

50oddordinary

How ordinary this draw is

Scored 50 of 100 across six shape features — more typical than about 44% of every possible ticket.

  • sum8th
  • odd48th
  • low94th
  • widest gap65th
  • neighbours25th
  • spread72th
Draw Fingerprints →

Each number, as it stood before this draw

Times drawn before — chance expected 214 of each

1175times
4220times
13215times
18201times
25205times
42215times

Every number was expected about that many times after 1,744 draws, and they scatter around it. Warm means more than expected, cool means fewer — and a cold number arriving is exactly what cold numbers do.

Frequency Explorer →

Its nearest twin

Shares 4 of 6 numbers (4, 13, 18, 42) with the draw of 24 February 2010 — its closest relative in 1,744 draws. Chance gave a match this close a 82% likelihood somewhere in that history.

From the draw just before (16 September 2026): nothing carried over. Chance says 56% of draws repeat at least one number.

Carry-over / Déjà Vu →

Sum and shape

103

The numbers add up to 103 — the 8th percentile of all possible tickets, around a middle of 150. No two numbers side by side. 50% of draws have at least one such pair.

Sum Distribution →

The longest wait in this draw

4 had not appeared for 22 draws. A number waits about 8 on average, and a wait this long was not a signal — the machine has no memory of it.

Gap & “Overdue” Tracker →

How many people held it

A line like this is played about 1.0× as often as an average ticket — about as popular as most. At 30 million tickets sold, a winner on these numbers would keep about 40% of the jackpot.

Illustrative model, calibrated to published studies — not live sales.

The Unpopular Numbers Edge →

73oddordinary

How ordinary this draw is

Scored 73 of 100 across six shape features — more typical than about 94% of every possible ticket.

  • sum54th
  • odd48th
  • low48th
  • widest gap42th
  • neighbours25th
  • spread91th
Draw Fingerprints →

Each number, as it stood before this draw

Times drawn before — chance expected 213 of each

3225times
5194times
19197times
32182times
46214times
48224times

Every number was expected about that many times after 1,743 draws, and they scatter around it. Warm means more than expected, cool means fewer — and a cold number arriving is exactly what cold numbers do.

Frequency Explorer →

Its nearest twin

Shares 4 of 6 numbers (5, 19, 32, 46) with the draw of 24 March 2010 — its closest relative in 1,743 draws. Chance gave a match this close a 82% likelihood somewhere in that history.

From the draw just before (12 September 2026): 3, 32 carried over. Chance says 56% of draws repeat at least one number.

Carry-over / Déjà Vu →

Sum and shape

153

The numbers add up to 153 — the 53th percentile of all possible tickets, around a middle of 150. No two numbers side by side. 50% of draws have at least one such pair.

Sum Distribution →

The longest wait in this draw

19 had not appeared for 20 draws. A number waits about 8 on average, and a wait this long was not a signal — the machine has no memory of it.

Gap & “Overdue” Tracker →

How many people held it

A line like this is played about 0.8× as often as an average ticket — less popular than most. At 30 million tickets sold, a winner on these numbers would keep about 50% of the jackpot.

Illustrative model, calibrated to published studies — not live sales.

The Unpopular Numbers Edge →
56oddordinary

How ordinary this draw is

Scored 56 of 100 across six shape features — more typical than about 61% of every possible ticket.

  • sum6th
  • odd48th
  • low77th
  • widest gap42th
  • neighbours25th
  • spread25th
Draw Fingerprints →

Each number, as it stood before this draw

Times drawn before — chance expected 213 of each

1174times
3224times
17208times
20211times
26206times
32181times

Every number was expected about that many times after 1,742 draws, and they scatter around it. Warm means more than expected, cool means fewer — and a cold number arriving is exactly what cold numbers do.

Frequency Explorer →

Its nearest twin

Shares 4 of 6 numbers (1, 3, 26, 32) with the draw of 22 March 2025 — its closest relative in 1,742 draws. Chance gave a match this close a 82% likelihood somewhere in that history.

From the draw just before (9 September 2026): nothing carried over. Chance says 56% of draws repeat at least one number.

Carry-over / Déjà Vu →

Sum and shape

99

The numbers add up to 99 — the 6th percentile of all possible tickets, around a middle of 150. No two numbers side by side. 50% of draws have at least one such pair.

Sum Distribution →

The longest wait in this draw

26 had not appeared for 24 draws. A number waits about 8 on average, and a wait this long was not a signal — the machine has no memory of it.

Gap & “Overdue” Tracker →

How many people held it

A line like this is played about 1.6× as often as an average ticket — more popular than most. At 30 million tickets sold, a winner on these numbers would keep about 28% of the jackpot.

Illustrative model, calibrated to published studies — not live sales.

The Unpopular Numbers Edge →
42oddordinary

How ordinary this draw is

Scored 42 of 100 across six shape features — more typical than about 26% of every possible ticket.

  • sum83th
  • odd77th
  • low20th
  • widest gap8th
  • neighbours25th
  • spread33th
Draw Fingerprints →

Each number, as it stood before this draw

Times drawn before — chance expected 213 of each

14191times
18200times
27216times
35221times
41227times
47196times

Every number was expected about that many times after 1,741 draws, and they scatter around it. Warm means more than expected, cool means fewer — and a cold number arriving is exactly what cold numbers do.

Frequency Explorer →

Its nearest twin

Shares 4 of 6 numbers (14, 18, 35, 41) with the draw of 24 February 2016 — its closest relative in 1,741 draws. Chance gave a match this close a 82% likelihood somewhere in that history.

From the draw just before (5 September 2026): nothing carried over. Chance says 56% of draws repeat at least one number.

Carry-over / Déjà Vu →

Sum and shape

182

The numbers add up to 182 — the 83th percentile of all possible tickets, around a middle of 150. No two numbers side by side. 50% of draws have at least one such pair.

Sum Distribution →

The longest wait in this draw

47 had not appeared for 19 draws. A number waits about 8 on average, and a wait this long was not a signal — the machine has no memory of it.

Gap & “Overdue” Tracker →

How many people held it

A line like this is played about 0.6× as often as an average ticket — less popular than most. At 30 million tickets sold, a winner on these numbers would keep about 58% of the jackpot.

Illustrative model, calibrated to published studies — not live sales.

The Unpopular Numbers Edge →

70oddordinary

How ordinary this draw is

Scored 70 of 100 across six shape features — more typical than about 91% of every possible ticket.

  • sum58th
  • odd48th
  • low48th
  • widest gap65th
  • neighbours25th
  • spread87th
Draw Fingerprints →

Each number, as it stood before this draw

Times drawn before — chance expected 213 of each

5193times
10232times
17207times
34217times
42214times
49218times

Every number was expected about that many times after 1,740 draws, and they scatter around it. Warm means more than expected, cool means fewer — and a cold number arriving is exactly what cold numbers do.

Frequency Explorer →

Its nearest twin

Shares 3 of 6 numbers (5, 10, 34) with the draw of 11 July 2026 — its closest relative in 1,740 draws. Chance gave a match this close a 100% likelihood somewhere in that history.

From the draw just before (2 September 2026): 17 carried over. Chance says 56% of draws repeat at least one number.

Carry-over / Déjà Vu →

Sum and shape

157

The numbers add up to 157 — the 58th percentile of all possible tickets, around a middle of 150. No two numbers side by side. 50% of draws have at least one such pair.

Sum Distribution →

The longest wait in this draw

42 had not appeared for 17 draws. A number waits about 8 on average, and a wait this long was not a signal — the machine has no memory of it.

Gap & “Overdue” Tracker →

How many people held it

A line like this is played about 0.7× as often as an average ticket — less popular than most. At 30 million tickets sold, a winner on these numbers would keep about 51% of the jackpot.

Illustrative model, calibrated to published studies — not live sales.

The Unpopular Numbers Edge →

29oddordinary

How ordinary this draw is

Scored 29 of 100 across six shape features — more typical than about 8% of every possible ticket.

  • sum1th
  • odd48th
  • low99th
  • widest gap5th
  • neighbours70th
  • spread2th
Draw Fingerprints →

Each number, as it stood before this draw

Times drawn before — chance expected 213 of each

6201times
8217times
9231times
14190times
17206times
25204times

Every number was expected about that many times after 1,739 draws, and they scatter around it. Warm means more than expected, cool means fewer — and a cold number arriving is exactly what cold numbers do.

Frequency Explorer →

Its nearest twin

Shares 3 of 6 numbers (6, 8, 14) with the draw of 11 March 2026 — its closest relative in 1,739 draws. Chance gave a match this close a 100% likelihood somewhere in that history.

From the draw just before (29 August 2026): 25 carried over. Chance says 56% of draws repeat at least one number.

Carry-over / Déjà Vu →

Sum and shape

79

The numbers add up to 79 — the 1th percentile of all possible tickets, around a middle of 150. Side-by-side numbers: 8–9. 50% of draws have at least one such pair.

Sum Distribution →

The longest wait in this draw

8 had not appeared for 9 draws. A number waits about 8 on average, and a wait this long was not a signal — the machine has no memory of it.

Gap & “Overdue” Tracker →

How many people held it

A line like this is played about 3.6× as often as an average ticket — more popular than most. At 30 million tickets sold, a winner on these numbers would keep about 13% of the jackpot.

Illustrative model, calibrated to published studies — not live sales.

The Unpopular Numbers Edge →